Latest Housing Reports - Redbook Sales Growth Improves
I’m always looking for new ways to interpret data. I’m never going to completely discard a report because economic reports’ accuracy varies. For example, jobless claims have been extremely low even though the labor market probably isn’t full based on the prime age labor force participation rate.
People simply aren’t getting benefits as often as they used to. That could change in the next recession as people demand to be helped. Another example is the ISM report. I’m not sure why it has recently been more optimistic than other reports, but it might come in line with reality if its methodology is updated.
This brings us to the Redbook retail store sales report. Some economists and investors started to ignore the Redbook results because the growth rate hit a cycle high in December even though retail sales were terrible. Furthermore, recently it has been lifted higher by discount store sales. Just because the Goldman retail sales calculation has recently been more accurate than Redbook, doesn’t mean we should ignore Redbook.
Latest Housing Reports - No model or survey can perfectly predict hard data.
The recent solid March retail sales report makes Redbook look slightly better since it has been showing higher growth. Personally, I don’t care about a perfectly accurate report. I care about the trend changes. The December retail sales report was important because it was unlike the others in 2018. It didn’t send stocks down because it was released a few weeks late because of the government shutdown. The bulls are lucky that report was delayed.
Redbook year over year same store sales growth in the week of April 20th was 6% which was up from 5% in the previous week. Month to date sales growth in April was 1.2% over the full month of March. It’s possible that the report was helped by the late Easter. I’m interested in seeing how the Easter season impacts April’s retail sales results.
Even with the delayed Easter, retail sales were strong in March, partially because of the seasonal adjustment. I don’t discount seasonal adjustments. I look at the non-seasonally adjusted data to understand its effect because it can be wrong.
Latest Housing Reports - Weak Existing Home Sales
Let's go over the recent reports from the housing market. It’s a mixed bag. The March existing home sales report was terrible. GDP growth isn’t helped by this report because it is just homes changing hands. However, existing home sales are about 90% of the housing market, so it is an important indicator to follow.
As you can see from the chart below, existing home sales were 5.21 million in March which was down from 5.48 million and missed estimates for 5.3 million.
The very strong February report was revised slightly lower from 5.51 million. March monthly growth rate was -4.9% which was down from 11.2% in the previous month. Similarly, the yearly growth rate fell from -2.3% to -5.4%.
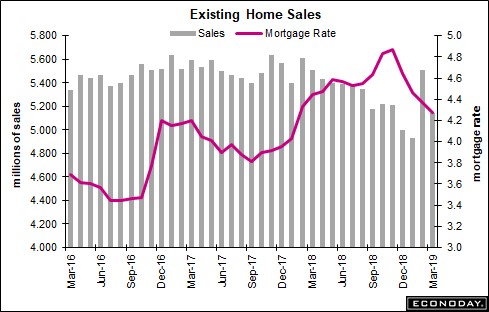
3 month moving average rose because the March reading was higher than the December one. The 3 month average was 5.207 million which was a 1.4% increase.
Latest Housing Reports - That’s the highest average since November.
Principally because of the strong February reading. It’s still way below the peak of 5.563 million in December 2017.
My thesis on the housing market took a hit from this report as I expect demand to rebound because of low price growth. While yearly price growth of 3.8% was low, monthly price growth of 3.7% pushed the selling price of existing homes to $259,400. Housing supply increased 3.1% to 1.68 million.
In relation to sales, inventory increased from 3.6 months to 3.9 months. Even though inventory increased versus sales, the market is still tight because anything below 5 months signals a supply constraint. In every region, sales fell on a monthly basis. The worst region on a yearly basis was the West which had a 10.7% drop.
Latest Housing Reports - Weak MBA Applications Index
We’ve seen weak starts, permits, and existing home sales in the past few days. One silver lining had been the MBA Applications index. It failed in the week of April 19th. composite index fell 7.3% weekly on top of -3.5% growth in the previous week. The past 2 weeks were driven lower by refinancing, but this time the purchase index also fell.
Purchase index fell 4% on top of a 1% increase and the refinance index fell 11% on top of an 8% decline. The purchase index’s 5 week winning streak ended as yearly growth was only 3%. Momentum created by the decline in rates might be fading.
Latest Housing Reports - New Home Sales Beat Estimates
Finally, after a string of bad housing data, the March new home sales report beat estimates. On a seasonally adjusted basis, March new home sales were 692,000 which beat estimates for 645,000 and beat the high end of the consensus range which was 660,000.
As the chart below shows, February new home sales were 662,000 which was a -5,000 revision. The prior month was revised down 11,000. March report was the highest since November 2017. It supports the thesis that the housing market is recovering. Results were strong and new home sale prices fell. Median new home prices fell 0.3% monthly to $302,700. That’s a 9.7% yearly decline. Yearly sales growth was 3%.

Sales increase pushed the supply of new homes down 0.3% to 344,000. Supply of new homes fell from 6.3 months to 6 months which is still ample supply. West had a strong sequential improvement from 165,000 to 176,000, but yearly growth was still -4.3%. South was very strong as sales increased from 387,000 to 401,000. That worked out to a 9.3% yearly gain.
Latest Housing Reports - Conclusion
Redbook sales growth improved probably because of the Easter holiday. Let’s see next week’s report before we jump to conclusions about a trend improvement.
Latest housing market reports have been mixed as MBA purchase applications grew only 3% yearly, the existing home sales report missed estimates, and the new home sales report beat estimates.