Beige Book Same As Usual
On Wednesday the Fed released its Beige Book report. The report showed more of the same trends the economy has been going through. For example, the majority of Fed districts said there was only moderate wage pressure despite the low unemployment and jobless claims which we’ll review later. The Fed needs to acknowledge that the influx of workers in Asia and the skills gap are preventing employers from hiring workers with higher wages. If the Fed acknowledged this, it might consider being cautious with rate hikes. While the tax cut will keep more money in most people’s pockets, it won’t catalyze wage growth.
Industrial Output
We’re now getting economic reports for September which allow the final estimate for GDP to be released next Friday. One of those reports is industrial production. It was up 0.3% in September which improved from the 0.7% decline in August which was weak because of hurricane Harvey. September was weakened 0.25% by the hurricanes. The report met economists’ estimates. The industrial capacity to utilization rate increased 0.2% to 76.0%.
Jobless Claims Best In 44 years
Some investors question how the largest decline in the S&P 500 this year has only been 2.8%. I personally wonder if this is one of the best economies in the past 100 years or if volatility has been squelched because of ETF ownership. One of the reports which supports the notion that this is a particularly great economy is the jobless claims. Last week’s report showed only 222,000 claims which I would have thought was impossible if you had asked me last year. That’s the lowest report since March 1973 which was when the labor market was much smaller. Part of the reason for the decline was because of the Columbus holiday on Monday. The 22,000 decline was the largest decline since April. Expectations were for 240,000. This is a strong indicator the non-farm payrolls report for October will show more than 100,000 jobs created.
Leading Indicators
The index of American leading indicators fell 0.2% in September which was the first decline in the past year. Current conditions increased 0.1% and past conditions fell 0.1%. This decline was spurred by the hurricanes. Ironically, the jobless claims caused the leading indicators index to fall. It’s ironic to see jobless claims causing a weak result just as it reports the best weekly report in 44 years. It shows the next leading indicators report will likely show growth.
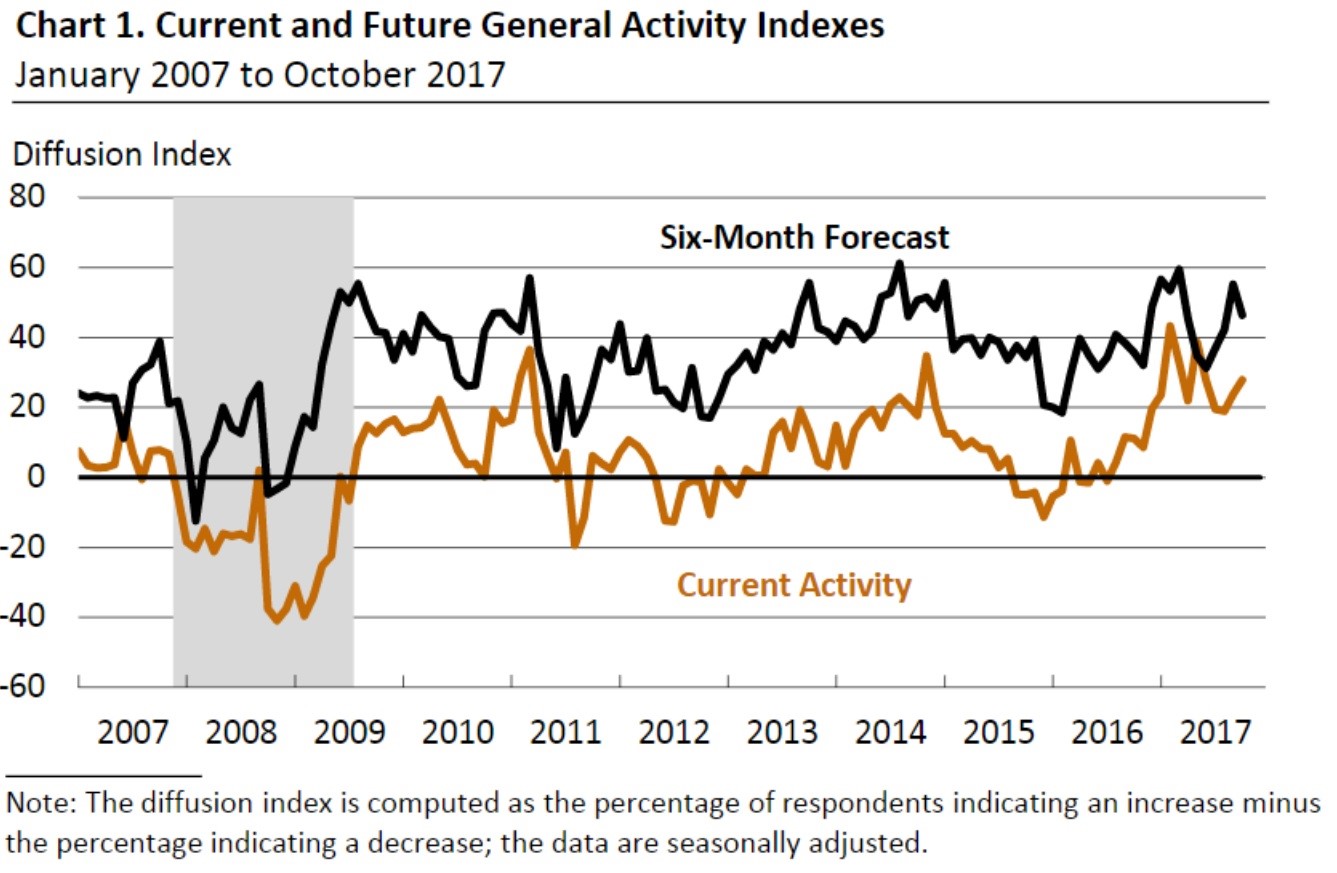
Philly Fed Manufacturing Business Outlook Survey
As you can see from the chart below, the current activity in the Philly Fed manufacturing report improved from 23.8 to 27.9 in October. However, the 6 month forecast fell from 55.2 to 46.4. The current employment index hit a record high showing once again that the manufacturing labor market is very tight. People in the service sector either must not think there’s opportunity in manufacturing or don’t live in the areas where the jobs are available. This is one example where wage growth isn’t occurring because qualified workers aren’t taking the jobs. If an employer raises wages for potential employees which never apply for the jobs, the economy won’t show overall wage growth. The price paid index increased 3.7 points to 38.1. The prices received index fell from 22.8 to 14.2. There’s nothing to indicate inflation will accelerate in October even in the manufacturing sector which is currently running hot.
One of the special questions asked in this survey was if business plans assume changes to federal tax policy in 2018. 12.9% said yes and 87.1% said no. I’m surprised any businesses would make plans based on something the government will do given its past track record of not getting anything done. The fact that most aren’t reacting to tax changes also means there will be a major reaction if anything gets done. 2018 could be a great year for the economy if the correct decisions are made on tax policy.
GDP Forecasts
As I mentioned, the first advanced report for Q3 GDP will come out next Friday. This means the GDP forecasts should be accurate by now. However, given the divergence amongst them, it’s impossible for them all to be close to correct. The GDP Now report from the Atlanta Fed has Q3 annualized GDP coming in at 2.7% That update on October 18th was unchanged from the forecast on October 13th. The estimate for real investment growth fell from -4.1% to -4.3% because of the new residential construction report on Wednesday. The NY Fed’s guess, on the other hand, is for 1.46% growth as it fell from 1.7%. The biggest cause for decline was data revisions. This is the second to last estimate that will be put out. The Q4 estimate is much more optimistic as it expects 2.61% growth. The St. Louis Fed prediction for Q3 is the most optimistic at 3.13%. The blue chip average is in between these estimates as it’s at 2.4%. The report will clearly be affected by the hurricanes. It makes it harder than usual to come up with a guess. Judging by some of the economic reports, it seems like the Q4 result will be very positive, making 2017 one of the fastest growing years of this economic expansion.
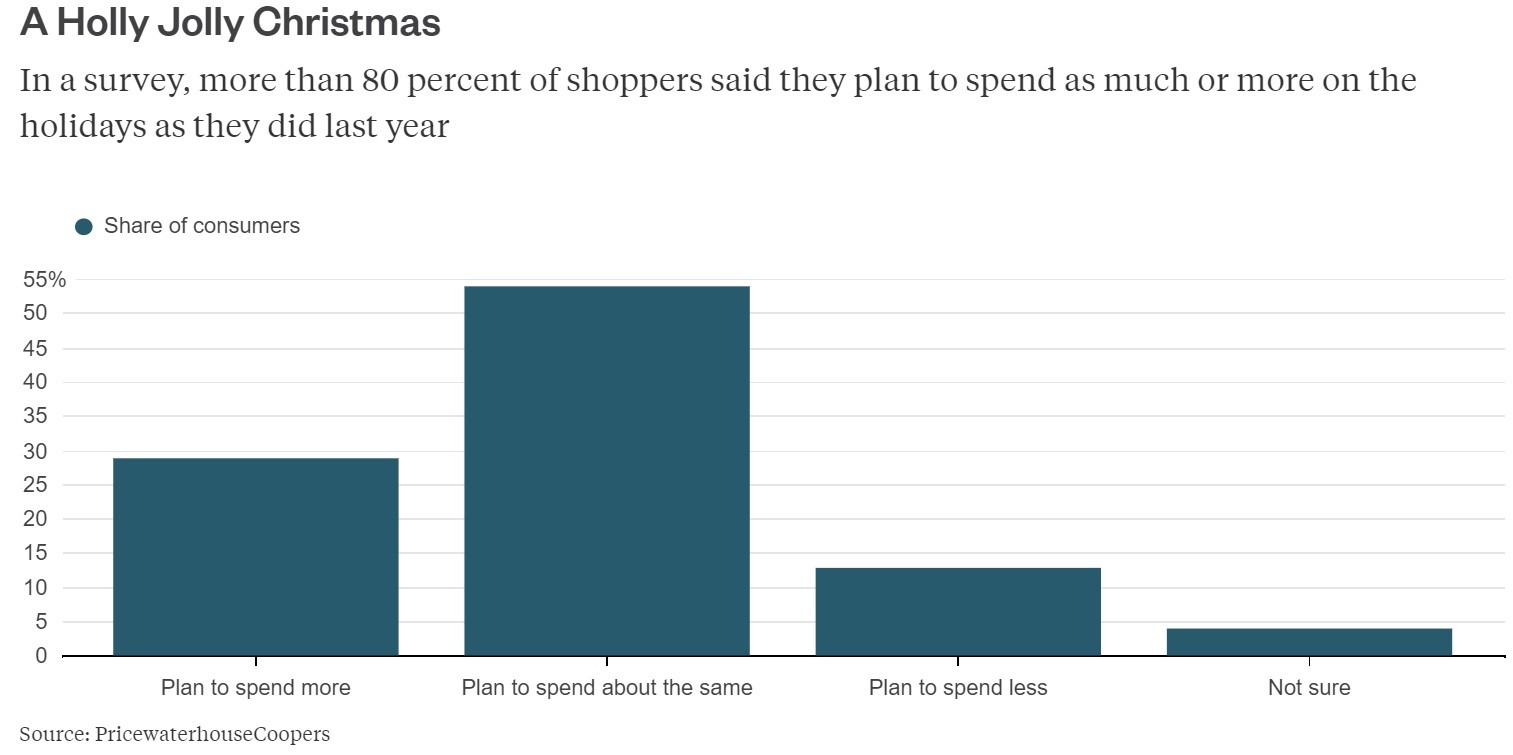
Clearly Q4 GDP will be dependent on the holiday season sales. The chart below shows the early leanings are positive. As you can see, almost 30% plan to spend more and less than 15% plan to spend less. This is only a rough estimate, but getting into the specific amounts would be too early for now. Those surveys will be done in November.
Conclusion
Not everything is going perfectly, but it sure seems like it when you review the economic reports. The manufacturing sector is doing well after a bad 2015-2016 period. If the Q3 GDP report comes in strong, this could be one of the strongest economic years of this expansion because Q2 growth was 3.1% and Q4 looks like it will probably be above 2.5%. As always, keep in mind the advanced Q3 report will be revised significantly in the coming months.