Slight Weakness In Flash PMI
Tuesday’s reading of the flash PMI for July was encouraging for manufacturing, but the composite headline number missed estimates because of services. The composite reading was 55.9 which missed estimates for 56.3 and was below last month’s report of 56. The manufacturing PMI was 55.5 which beat estimates for 54.9 and last month’s reading of 54.6. Services were weaker as the PMI was 56.2 which missed estimates for 56.4 and last month’s report of 56.5. You can see how much more important services are than manufacturing to the composite index as slight weakness in services overcame strength in manufacturing. Last month’s report was the opposite as services were strong in June.
This PMI data is consistent with GDP growth of 3%. Since I expect a decline from Q2’s growth rate, 3% would be amazing. Keep in mind this is just the flash reading of the first month’s data, so the economy is a long way away from achieving 3% growth. It’s interesting that manufacturing strength was in America while export sales had their largest drop in two years. This may be related to the trade skirmishes. Delivery times were the slowest in 11 years as firms tried to build up inventories to combat scarcity.
Cost pressures for manufacturing and services were the highest in 5 years; pass through to customers was the highest in 9 years. The last PPI report showed high inflation, but the CPI report showed that wasn’t transferring to consumers. There might be a change in the pass through of costs throughout the supply chain occurring in July. The increase in costs is coming from increasing salaries, increasing raw materials costs, especially metals, and increasing energy prices. Hiring was the slowest in the past year because of the lack of skilled workers. I still expect the July employment report to show strength because the jobless claims were low.
Richmond Fed Report Shows Continued Strength
The Richmond Fed manufacturing report was great as the headline index was 20 which was down 1 point from last month and was 1 point better than the consensus. The new orders index was 22 which matched last month’s reading. Local business conditions were up 5 points to 18. We saw weakness in capex in the Empire Fed report, but the Richmond Fed services expenditures index went from 1 to 6. We saw weakness in the expectations index in the Philly Fed report. There was weakness in the Richmond Fed report was well as the volume of new orders index fell from 46 to 39. This drop was smaller than the Philly Fed’s drop and the result is much more optimistic.
The extreme price inflation that we saw in the Philly Fed report was echoed in this report. The prices paid index went from 3.14 to 3.54 and the prices received index went from 1.72 to 2.24. As you can see, a great deal of the soft data is showing a pick up in inflation. Keep in mind, this is July data. The next PCE report, which will be released next Tuesday, will be the June reading. The core PCE inflation was 2% in May. I expect a sharp increase in this reading in June, July, and August because of easy comparisons. There are also cyclical pressures such as the tightening labor market and the increased prices in commodities which are partially driven by the tariffs. The expectation for prices also increased dramatically in the Richmond Fed report. The prices paid index went from 2 to 2.84 and the prices received index went from 1.46 to 2.74.
Slight Weakness In The Kansas City Fed Manufacturing Survey
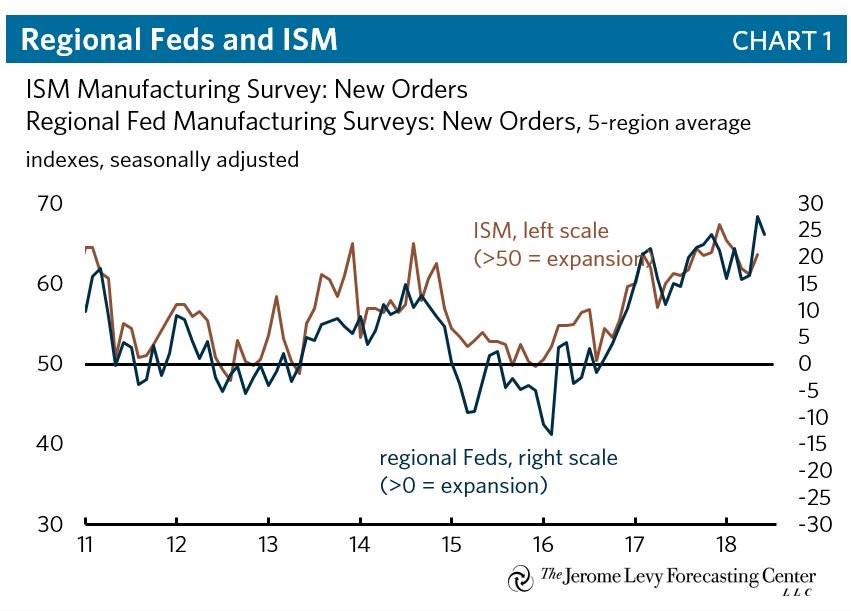
The chart below compares the regional Fed reports to the ISM PMI. This latest reading includes the Richmond Fed report and the Kansas City Fed report which I will discuss next. As you can see, the average has dipped a little bit which means the ISM should fall slightly. The ISM report also has a high correlation with the 10 year treasury yield. The recent increase in the yield could mean a higher ISM. More importantly, the increase in the 10 year yield could mean economic growth will be quicker than expected in the second half.
The Kansas City Fed report brought down the average of the regional Fed reports as compared to last month as the index went from 28 in June to 23 in July. The new orders index was down 6 points to 21. The production index fell 16 points to 22. The volume of shipments decreased from 39 to just 12. This was partially caused by the extended delays in shipments as delivery times were up from 22 to 28. Price inflation was similar to the other regional Fed reports as the prices paid for raw materials index was up from 47 to 52 and the prices received for finished products index was up from 22 to 27. The expectations index was down slightly from 36 to 34 as it didn’t follow the Philly Fed despite the weakness in the current headline reading.
Durable Goods Report
The June durable goods report gives us our final inkling into the Q2 GDP report. The results were solid. Your viewpoint on the report depends on whether you care more about Friday’s GDP reading or long term growth. The aircraft orders affect GDP, but don’t mean much for the medium term economy. New orders were up 1% month over month which was up from -0.3% last month, but badly missed estimates for 3.2% growth. Excluding transportation, orders were up 0.4% which missed estimates by 0.1% and beat last month’s report by 0.2%. Core capital goods orders were up 0.6% which beat estimates by 0.1% and were 0.1% below last month’s report.
Civilian aircraft orders had a sharp turnaround as I expected. They were up 15.7% after being down 21% and 39.4% in the past two quarters. Core capital goods shipments were up 1% which should help the nonresidential investment part of GDP. Primary metals orders were down 0.4%. Fabricated metals orders were up 0.1%. This contrasts with the soft data reports which show primary metals and fabrications inventories are increasing.