Weak Pending Home Sales
We have seen solid housing stats recently as new home sales in June hit a record high. However, the pending home sales index wasn’t part of this group of reports. After a good reading of 108.3 in June, the index fell 2.5% to 105.6 as you can see from the chart below. Estimates were for a 0.3% decline and the low end of the consensus range was -1%. Both were obviously missed. Since the bottom in December, there have been 3 sequential declines. The declines have come after very strong readings. This index implies one of the existing home sales reports in the next 1-2 months will be weak. That’s if the pending index isn’t revised higher. As you can see, over the next few months, yearly comps will get much easier. In the last 3 months of the year, the index will have positive yearly growth even if the uptrend ends.
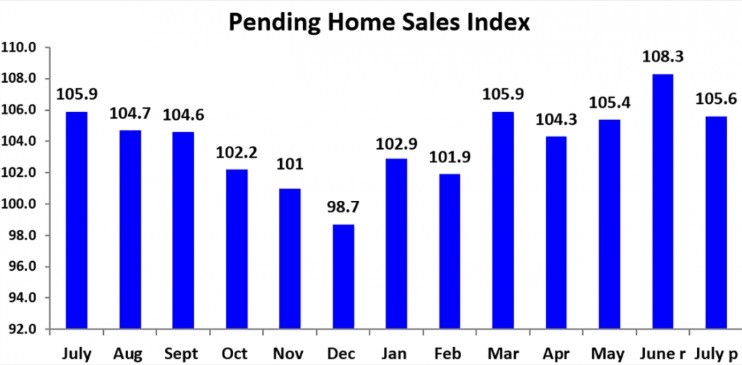
We’ve seen strong readings from the West in the past few housing reports. This report didn’t continue that trend as the West’s index fell 3.4% from June. That was the worst decline out of the 4 regions. The West’s index was also the lowest as it was 93.2. The Northeast had the best growth as it fell 1.6%. The Midwest fell 2.5% and the South fell 2.4%. All economic data from the South will be impacted by hurricane Dorian. It is currently a category 3 storm with winds of 115 miles per hour. It will make landfall in Florida on September 1st.
Leading Index Falls Slightly
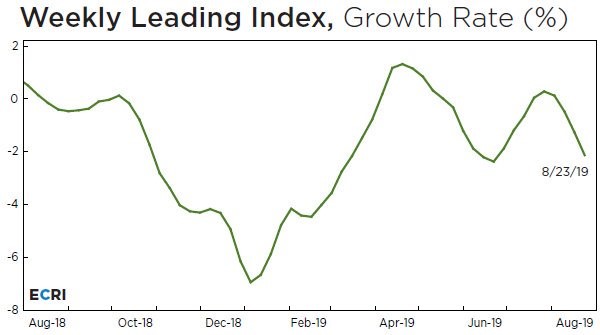
As you can see from the chart below, in the week of August 23rd, the ECRI leading index’s growth rate fell from -1.3% to -2.1%. In late September and early October, the comps will get tougher which will probably make this index’s growth rate fall. Then in November, the comps get much easier and growth should be positive. The growth decline in this latest reading wasn’t due to comps though as the index fell 0.7 to 143.1.
It was probably hurt by the weakness in the stock market. That will change next week as the S&P 500 was up 2.79% this week. The index hasn’t given a strong prediction on the economy since it called for a slowdown in Q2 and Q3 of this year. Once we get through this cyclically weak period, the economy can recover next year if there is a trade deal. That’s a big “if.” Without a deal, the picture will be mixed like this index forecasts.
Income Growth Misses Estimates & Consumption Growth Beats Estimates
The July PCE report was a mixed bag. The worst part of the report was real disposable income growth which missed estimates for 0.3% monthly growth, coming in at 0.1%. However, the June reading was revised from 0.4% to 0.5% which takes some of the sting out of that reading. Before calling this a disaster, remember yearly disposable income growth was a solid 3%. It fell from 3.3% even though the comp didn’t get tougher. While that’s not ideal, as you can see from the chart below, yearly growth is still above consumption growth which had a great monthly growth reading in this report.

Consumer spending growth was 0.6% monthly which beat estimates for 0.5%. That’s double June’s growth rate. Real PCE growth was 0.4%. Don’t be confused by this growth rate being above real disposable income growth. Real yearly consumer spending growth was below income growth as it was 2.7%. Some are saying the consumer doesn’t care about the tariffs. That might be the case, but I won’t use this report to support that thesis because the latest group of tariffs were announced and raised in August. The tariffs in September and December will have the biggest impact on the consumer so far. If they last into early 2020, you will see a reaction.
The savings rate actually fell even though yearly real consumption growth was below disposable income growth. It declined from 8% to 7.7% which is the lowest reading since November 2018. With the consumer not highly leveraged and the savings rate relatively high, I don’t see a problem with the savings rate falling slightly.
Inflation Might Be A Problem Soon
Headline and core PCE inflation both missed estimates on a yearly basis which means the Fed can cut rates if it wants in September. It’s not as if there was any chance the Fed wasn’t going to cut rates in September because of inflation. However, if core inflation creeps up, it can be a problem in 2020. That’s still a possibility. Specifically, monthly PCE inflation was 0.2% which met estimates and was one tenth above June. Yearly headline inflation was just 1.4% which missed estimates for 1.5%. Plus, the June reading was revised one tenth lower to 1.3%.
Core monthly PCE inflation was 0.2% which met estimates and June’s reading. Core yearly inflation was 1.6% which was the same as June and missed estimates for 1.7%. The worry for the Fed is that this report had the toughest comp of this mini cycle. Core inflation in July 2018 was the highest since January 2012. The 2 year stack increased 9 basis points. Core inflation will likely get closer to 2% by the end of the year as the comps get easier. July 2018 core inflation was 2.11% and October core inflation was 1.86%. Starting early next year, I could see core PCE above 2% if the economy doesn’t fall deeper into a slowdown. The Fed’s positioning would be a problem if it cut rates and then a trade deal was made. There would be an upswing in the economy and core PCE would be above 2%.
Conclusion
Pending home sales fell, but the housing market is still probably fine. The leading index doesn’t suggest big issues in 2020 especially if there is a trade deal. Consumption growth beat estimates and income growth missed estimates. Both are in solid shape on a yearly basis. Inflation missed estimates. However, core PCE will probably increase towards 2% in the next few months as the comps get easier.