Job Postings Improve Further
Even though last week’s jobless claims report was terrible, the Indeed data shows continued improvement. We will need to wait until next Thursday to see which is correct. The labor report is on Thursday because the 4th of July is causing a market holiday on the 3rd of July as the holiday is on a Saturday. We still get that Friday off.
We can expect the labor report to be better than the one in May, but not as spectacular as most initially thought it would be.
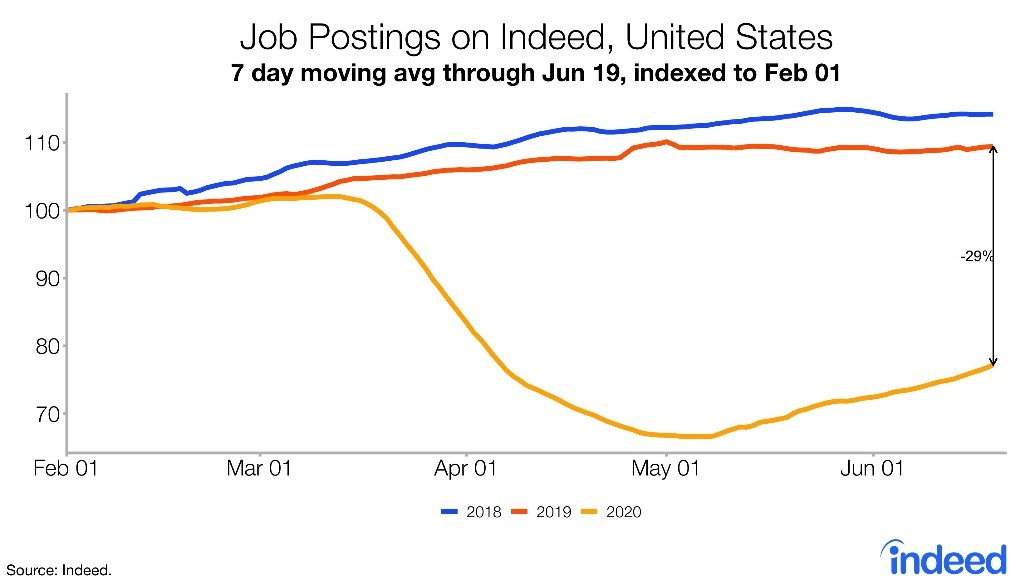
As you can see from the chart below, the 7 day moving average of job postings on Indeed is down 29% from last year. The index’s recovery since May has been slow and steady. It looks like it will be back to normal this fall if there is no 2nd wave of COVID-19. Job postings were lower in 2019 than in 2018 as there were fewer jobs created per month as the labor market filled up.

In 2019 it seemed that the labor market had room to fill up further. If it wasn’t for the COVID-19 crisis, it probably would have. That being said, in hindsight I’m calling it a full labor market. Improvements that would have occurred in 2020 would have been marginal. That’s in terms of the prime age labor force participation rate and the unemployment rate.
In terms of wage growth, low paid workers can always use more real wage growth. It would have been a good year for these workers. Instead they are getting additional income from the government. Markets are waiting with bated breadth as to what the government will decide. We'll discuss the plans when they become more concrete. Stocks are looking for a big boost to keep the economy going.
Let’s look at the details of the Indeed stats. Driving industry had the lowest yearly decline in job postings as it had a 0.6% decline. It’s up 25.3% since May 1st. Biggest increase since May 1st was retail with a 27.2% gain. Brick and mortar retail isn’t completely gone despite what the stock market implies. Wayfair and Carvana are up 134% and 31% year to date.
Biggest yearly decline was in hospitality and tourism which has a 57.9% decline in postings. And the biggest decline since May 1st was the 2.7% drop in banking and finance. Worst city was Honolulu which had a 45.7% yearly drop (5.5% gain since May 1st). It's remarkable that NYC/Jersey City has had gain since May 1st (down 40.8% since last year).
Morgan Stanley Data
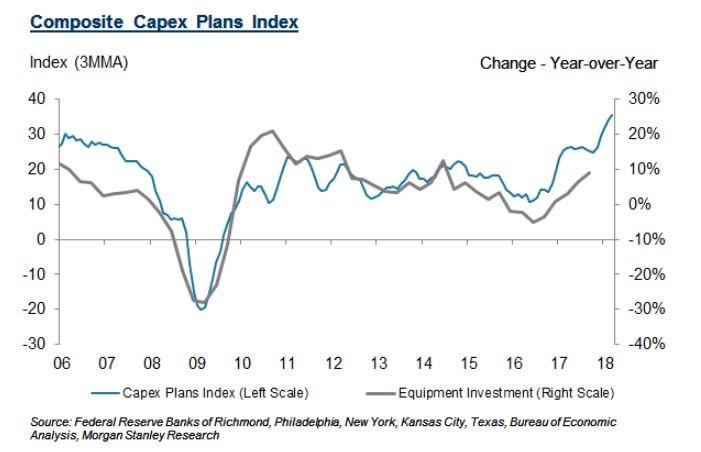
The charts below show Morgan Stanley data. It's surprising that both the 3 month average of capex plans and the 3 month average for hiring plans didn’t fall below the previous recession’s trough. Even the monthly data didn’t hit a new low, although, capex plans were close. Furthermore, it seems like the improvements in May weren’t that great. Overall, this data seems less volatile than most. It’s still worth keeping it in mind, since the data has been all over the map lately.
Chicago Fed National Activity Index Rebounds
All diffusion indexes will be strong in May because they compare results from the previous month. Obviously, the economy is improving from completely being shut down. April index was revised down from -16.74 to -17.89. You can see in the chart below, employment and production were the biggest contributors to that weakness. May reading bounced to 2.61 which beat estimates for -4.

Personally, I don’t think that’s strong. Of course, the economy improved. This is yet another example of economists being too negative. This is a perfect example of why the Citi Economic surprise index hit a record high. This trend of beats is unlikely to continue because economists will raise their forecasts for June. 57 of the 85 indicators in this diffusion index made positive contributions in June. 28 made negative contributions. 72 improved in May from April and 13 got worse.
Q2 Earnings Season Is Underway
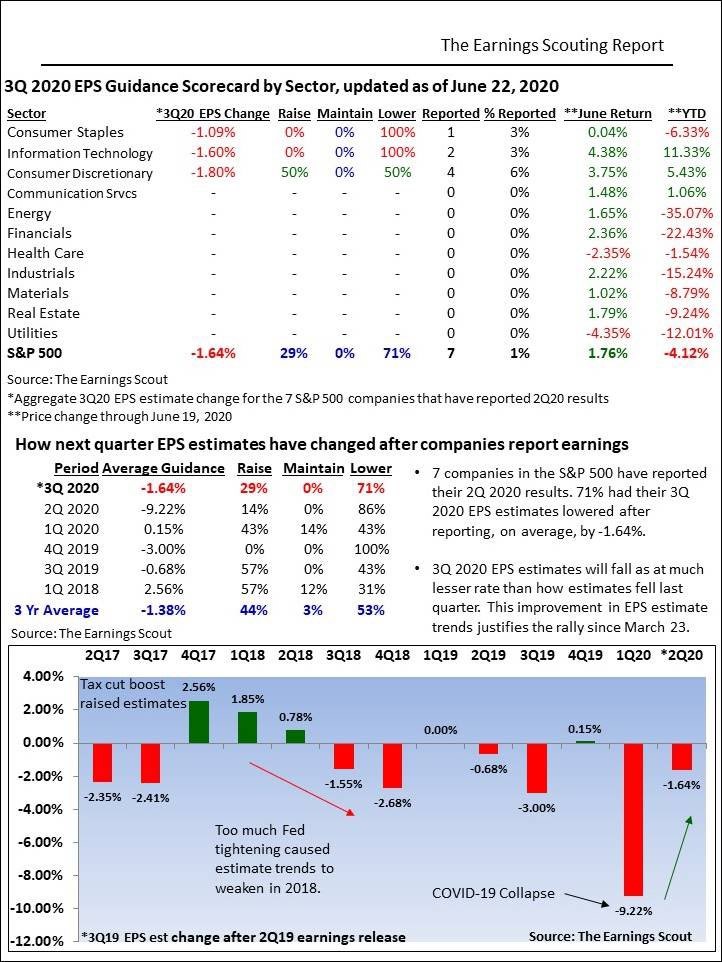
Earnings season will begin in earnest in July, but 7 firms have already reported their results. Early findings give us an idea of what is to come in the next few weeks. As you can see from the table below, these firms collectively had a 1.64% decline in their Q3 EPS estimates after reporting. That’s slightly worse than the 3 year average of -1.38% and way above last quarter’s decline of 9.22%.
Obviously, estimates won’t fall as badly as they did last quarter. It seemed a few months ago that last quarter’s earnings season would be worse than this quarter’s earnings because everyone focuses on guidance. Results this quarter will be terrible, but firms will go out of their way to say how much business has improved in Q3. They will give improved guidance and the ranges will be tightened back to normal.
COVID-19 Bad In A Few States
Some of the biggest worries should be about the firms with high exposure to Arizona, Florida, California, and Texas. Cases aren’t up just because of more testing. They are up because of the virus spreading as the positive rates are up in these few states. As you can see from the chart below, the cases per day divided by tests per day is rising, signaling the spike in cases isn’t because of more testing.

On June 22nd, there were 31,496 new cases in America with the most in California and Texas. There were 5,528 new cases in California which pushed the 7 day average to 29,180. Record high is 32,425. There were 5,112 new cases in Texas which is a record high. 5 day average is 4,038 which is also a record high.
In the entire country, the 7 day average of new cases was 29,180 which is slightly below the record of 32,425. It's likely the record will be broken this week. Good news is the 7 day average of deaths fell by 8 to 619. Bulls are pointing to the new lows in deaths which might be all this market needs to look past this crisis.