Economic Outlook Revisited
A peak in earnings growth doesn’t mean you should sell stocks. Earnings revisions give an upper hand in deciphering the results of each earnings season. The question for the intermediate term is if there are enough catalysts to bring 2019 earnings growth lower, eventually leading to a net decline and a bear market. The Venn diagram below gives us a great summary of the structural and cyclical changes to the market/economy which can help us figure out if a recession is coming after this recent economic boost brought about by the tax cuts. It’s too basic to just look at the yield curve and say there will be a recession in 2020 because the curve will invert in the next few months. More analysis needs to be done.
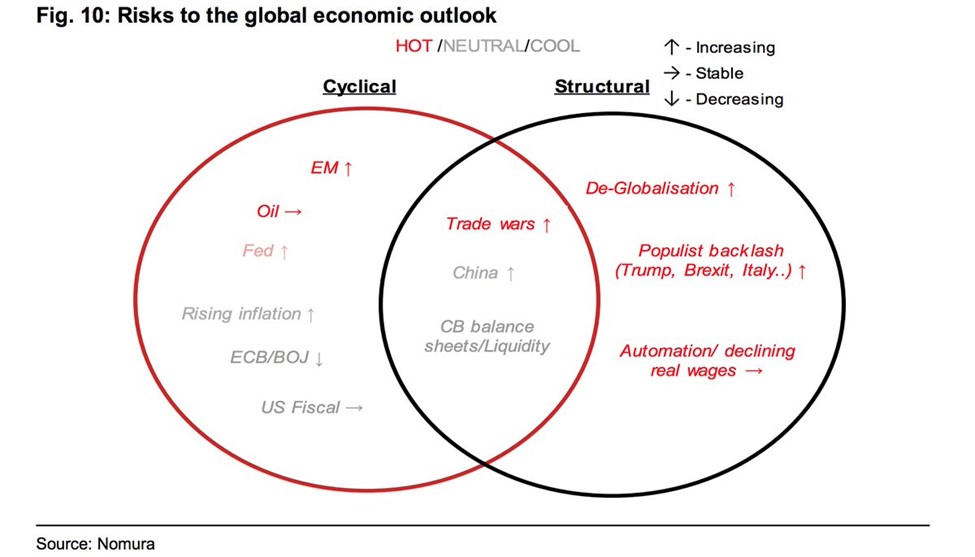
Emerging Market Risk Is Hot
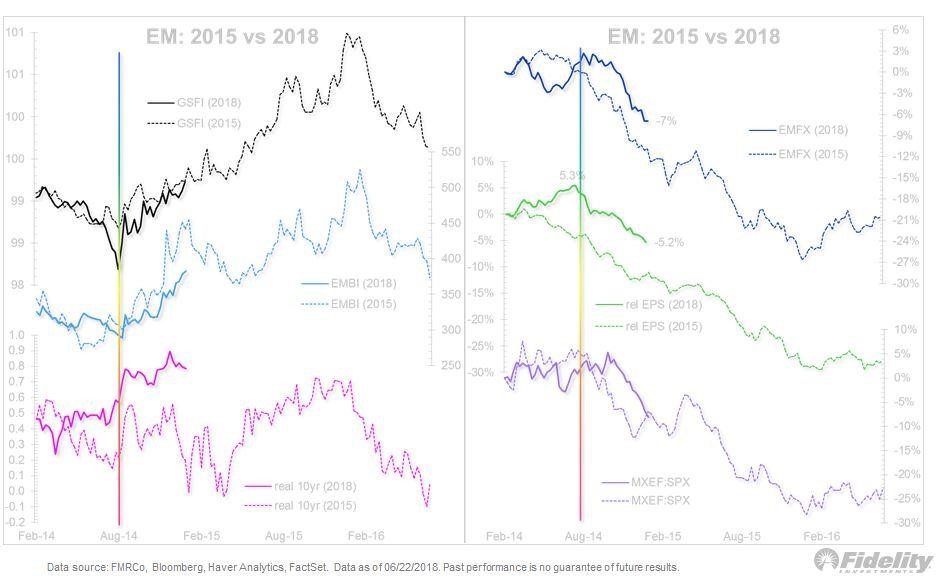
As you can see, there are two categories for each indicator: cyclical and structural (the middle grouping includes both). In the cyclical grouping, emerging markets are considered hot and the risk is increasing. With the rising dollar and the Fed rate hikes, many emerging markets are feeling the pain as their stock markets and currencies are declining. Some countries such as Brazil are seeing political volatility. India is an outlier which is improving. China is the elephant in the room as growth is decelerating after the quick bump up in in Q1. The chart below compares the 2018 emerging market volatility and economic weakness to the 2015 correction and weakness. As you can see, the 2018 declines are small compared to 2015, potentially signaling more problems are coming.
Oil Considered A Hot Indicator
In this chart, oil is a hot indicator and is stable. It’s very tough to say if oil is really stable because the price is so volatile. I don’t think oil is hot because fracking production limits the upside. Oil isn’t even in the triple digits like it was earlier in the cycle and the previous one. Furthermore, the oil market hurt the economy when it crashed from 2014-2016, not when it was high. It’s tough to categorize oil as hot or neutral because price increases hurt the consumer, but not enough to cause a recession. I think it’s somewhere in between those two options which would be light red.
I Think The Fed Is Contractionary
The Fed is the next cyclical indicator. In this chart, it is light red which means between hot and neutral. It is said to be a risk which is increasing; this makes sense because the Fed is raising rates. I disagree that the Fed is somewhere between neutral and hot. I think the Fed is hot, which is the equivalent to contractionary, because the yield curve is flattening and emerging markets are experiencing weakness.
It’s true that the economy is being hurt by the potential trade war, but it is being helped more by the tax cuts. If neither the tax cuts, nor the trade policies were in place, the Fed funds rate would be pressuring the economy in a more noticeable way. In a 9 inning baseball game, I would say the Fed is in the 7th inning of these rate hikes. I don’t think the Fed will hike in 2020.
Rising Inflation: Increasing Risk
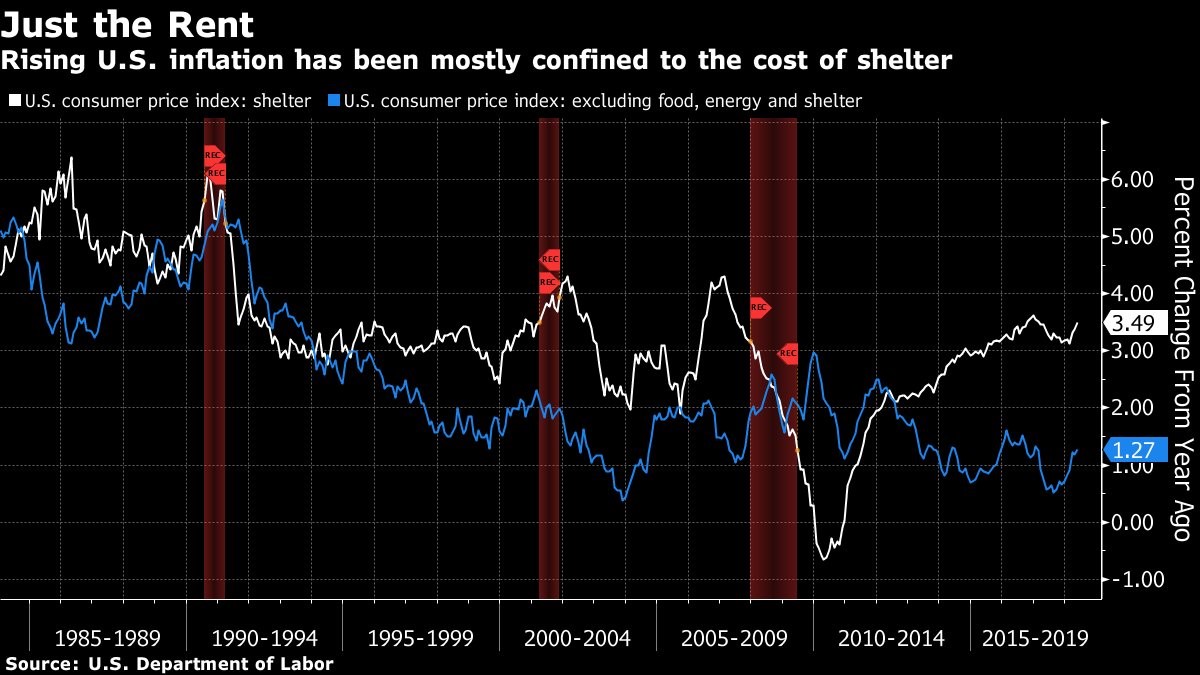
Rising inflation is considered to be a neutral risk which is getting worse. This is the correct way to describe this metric because inflation is near the Fed’s goal and is increasing. With the negative secular impact on inflation that is the aging population, it’s unlikely inflation will get out of control. I’m already worried about the Fed being contractionary even though inflation isn’t above the goal. The chart below shows inflation excluding energy, food, and shelter is not even close to the cycle high. Shelter inflation is the main issue. There needs to be more houses built to solve this problem.
ECB/BOJ
The ECB and BOJ risks are said to be cool and falling. I think this metric is neutral and becoming riskier because the European economy has relied on QE more than the American economy since the ECB stabilized the Italian political unrest and bought corporate debt which has supported zombie companies with high debt. Keep in mind, Nomura believes global GDP growth is peaking and Europe and Japan will be impacted the most. This isn’t really a prediction. It’s a summary of what is already happening. That’s not to say it won’t continue, but I’m always weary of analysis which extends the current trends. If trade deals are made, global growth could re-accelerate in the second half of 2018.
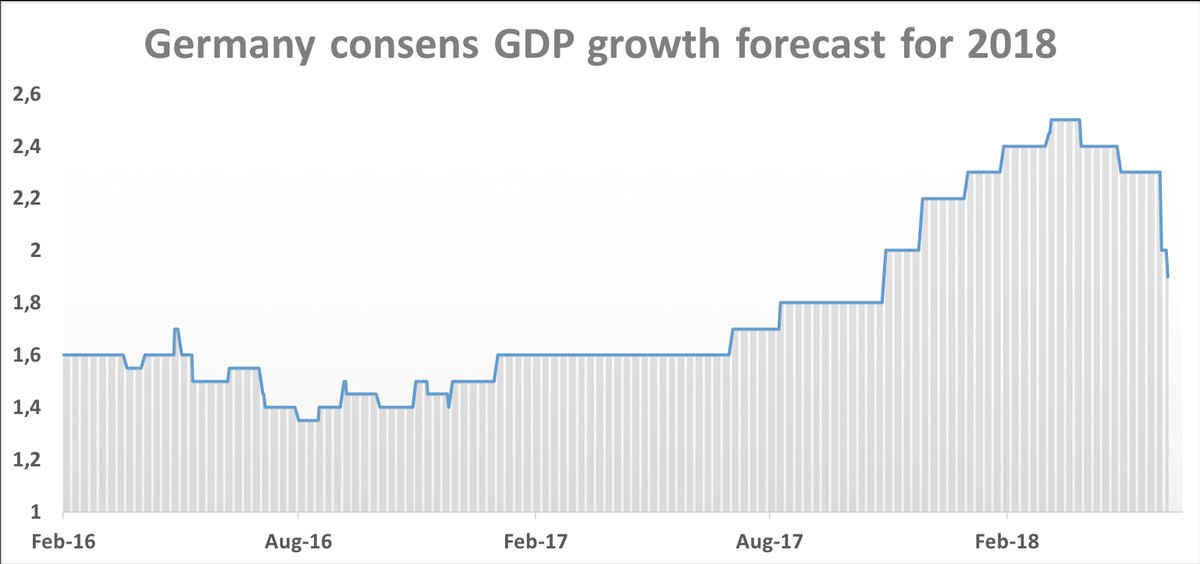
The chart below shows how the weakness is currently in the forecasts already. IFO Institute cut its German GDP forecast for 2018 from 2.6% to 1.8% and its 2019 forecasts from 2.1% to 1.8%. The consensus is for below 2% growth in 2018. IFO cited the risk of a Euro crisis because of Italy and a trade war with America as reasons for its bearishness. The latest weakness in Germany is coming from exports as its biggest trade partner, China, is seeing a deceleration in GDP growth. Trade tensions between America and China don’t help China, but they aren’t the principal reason for the slowing. I’m implying this weakness could be more sustainable than I mentioned earlier. I’m giving you both sides of the debate as it is hotly contested.
U.S. Fiscal Policy
Fiscal policy is considered a cool indicator which is stable. Fiscal policy is about as good as it gets, which means I agree that the policy is cool. The biggest risk to fiscal policy, which is the Democrats winning both houses of Congress in November, won’t even influence policy in the near term because Trump would veto any attempts to raise taxes on corporations or the upper income class. Even though Trump’s tariffs are causing market volatility, it appears his chances of helping the GOP in November have improved. The latest CNBC poll shows American’s approval of his economic policies increase 6 points to 51% (the disapproval rating is 36%).