Another ISM Beat
Before getting into the non-manufacturing ISM report, here’s an interesting fact. The 5 month period where the manufacturing ISM PMI was below 50 marks the 4th longest streak since 1950 where the manufacturing sector was in contraction outside of a recession.
Bears calling for a recession were wrong. That’s very clear now that both the ISM manufacturing and services PMIs beat estimates and increased. There won’t be a recession in 2020; instead there will be growth acceleration in the American economy. It would also be referring to the global economy if it wasn’t for the coronavirus in China. That's expected to shave 0.6% off China’s 2020 GDP growth.
Specifically, the non-manufacturing ISM PMI rose from 55 to 55.5 as you can see in the chart below. This beat estimates for 55.2. Exactly like the manufacturing report, this PMI beat its 1 year average by 0.1. It was the highest reading since August.
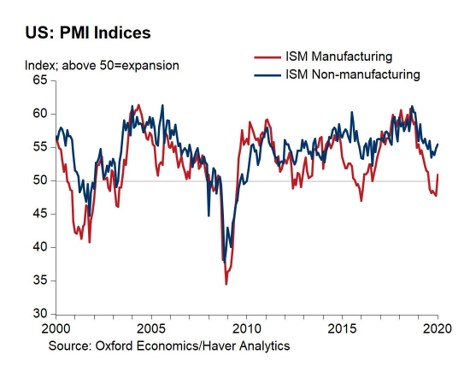
Just like the manufacturing report, this PMI is consistent with 2.4% GDP growth. Services PMI bottomed near where it did last slowdown. Since this headline reading increased by a smaller amount, the results in the underlying report were more mixed sequentially. 12 of 16 industries reported growth in business activity.
Business activity index was up 3.9 points to 60.9. New orders index was up 0.9 to 56.2. On the negative side, the employment index fell from 54.8 to 56.2. Countering that weak reading was the very strong ADP report. Consensus for the Friday jobs report still shows job creation rising 13,000 to 158,000. There’s little evidence to suggest job creation will be below 100,000. We expect 200,000 jobs to have been created.
Just like the manufacturing report, the inventories index fell. It was down 4.5 points to 46.5. I’m guessing with the recent drawdown in inventories in Q4 and January, inventory investment will increase in the next couple of months. That should help GDP growth after it hurt it by 1.1 point in Q4. The prices index fell 3.8 to 55.5 which makes sense because wage growth has been falling and commodities prices fell in January.
Exports fell 0.9 to 50.1 and imports rose 7.1 to 55.1. As expected, net trade won’t be a huge boon to Q1 GDP growth like it was to Q4 growth (1.5 points). On Wednesday, the international trade report showed the trade deficit rose from $43.7 billion to $48.9 billion. Obviously, the December reading doesn’t impact Q1 GDP growth, but it suggests the trend of decreasing deficits may be over.
There was just one mention of the tariffs in the comment section of this report. We saw the first mention of the Chinese coronavirus in this report as well. A healthcare and social assistance firm stated, “Closely monitoring China’s coronavirus and its potential impact on medical supplies like surgical masks and protective goggles.”
A seller of masks, Lakeland Industries, has recently seen its stock fall sharply as traders have stopped pricing in the situation getting worse. It seems like the market is over this issue. LAKE stock is down 24.35% since January 27th.
Fantastic ADP Report
January private sector jobs report from ADP was so amazing, it begs the question ‘is it too good to be true?’ We will find that out on Friday. For now, let’s look at the details of this report. Firstly, the December reading was revised down 3,000 jobs to 199,000. That’s still above the BLS reading.
Job creation was 291,000 in January which beat estimates for 154,000 and the highest estimate of 190,000. It was a dramatic beat. This was the 5th strongest reading relative to expectations in 13 years and the strongest in 8 years.
Interestingly, the ADP report has called for more than 250,000 jobs created 9 times this expansion and 8 of those times it was above the BLS report. It overestimated the BLS reading by an average of 86,000. To be clear, even if 205,000 private sector jobs were created, this would be a nice beat. This was the highest first estimate of job creation by ADP since February 2017 which was 71,000 above the BLS reading.
It was the 3rd highest first estimate in its 13 year history. If this is the final reading, it would be the most private sector jobs created since May 2015. Following the cycle low in yearly job growth, yearly growth increased from 1.52% to 1.54%. Growth is likely to start increasing sharply in May when the comps start to get easier.
Within this report, small firms created 94,000 jobs, mid-sized firms added 128,000 jobs, and large firms added 69,000 jobs. Small firms created the most jobs since July 2018. Other small firms created 68,000 jobs which was the most since January 2014. It’s surprising that goods producing firms added 54,000 jobs as the manufacturing sector added 10,000 jobs.
Manufacturing will likely be shown to have created fewer jobs in the BLS report. Construction added 47,000 jobs which is probably because of the strong residential housing market. That was its highest job creation since last January.
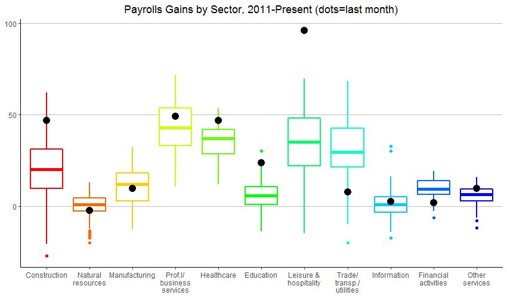
Services sector added 237,000 jobs. That was the most jobs it created since February 2016. Within the service sector, job creation was dominated by leisure and hospitality which added 96,000 jobs. As you can see from the chart below, that’s more than 2.5 standard deviations above the post-recession average.
Remember, this category pays the lowest average wages. If this job creation shows up in the BLS report, there will be lower wage growth. Education and healthcare drove job creation again as it added 70,000 jobs. Finally, professional and business added 49,000 jobs which was the highest since April. This was a good report even though low wage job creation was the strongest.
Conclusion
ISM non-manufacturing PMI was solid. One notable area of weakness, employment, was covered up by the great ADP report. Even if construction and leisure & hospitality created the same number of jobs as their 1 year average, job creation still would have been 190,000 which is above estimates for 150,000 private sector jobs in the BLS report.