Housing Price Growth - Home Price Growth Falls: Case Shiller
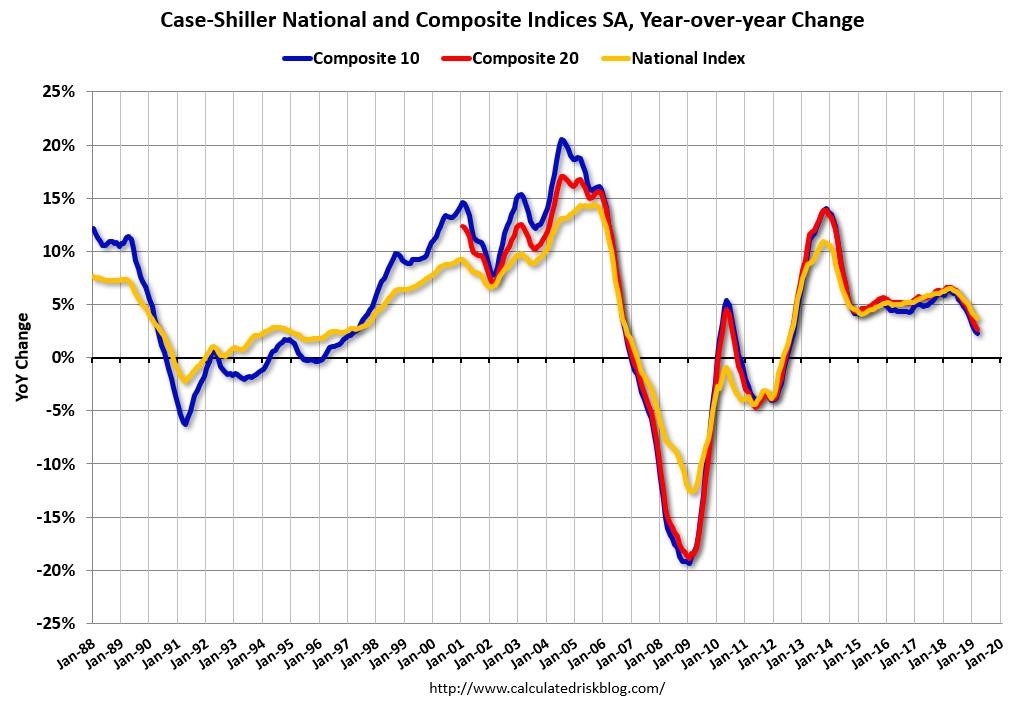
Housing Price Growth has taken a hit. As you can see from the chart below, the home price index’s growth rate has been plummeting in the past 6 months. Even though the last recession ended in 2009, it took a few years for the housing market to start recovering.
For example, the homeownership rate didn’t even bottom until Q2 2016. The non-seasonally adjusted national Case Shiller home price index bottomed in February 2012.
Llatest weakness in home price growth and the decline in interest rates are increasing mortgage purchase applications. That being said, if demand was that strong, it would reverse this trend in home price growth. If the labor market is steady, demand will eventually be enough to end this decline in price growth.
Investors don’t think there will be a yearly decline in prices. But if the labor market weakens, all bets are off. There won’t be an almost 15% decline like the last trough, but an almost 5% decline like in the early 1990s is possible in a recession.
In the March report, the 20 city index was up just 0.1% monthly which missed estimates for 0.2% growth and February’s reading of 0.3%. On a non-seasonally adjusted basis, prices were up 0.7% which beat estimates for 0.3% and the 0.2% increase in February.
Seasonal adjustment brought down price growth.
Housing Price Growth - On a yearly basis, the non-seasonally adjusted price growth was 2.7% which beat estimates for 2.5%, but was down from February’s 3% growth. That was a 7 year low.
National price index was up 3.7% and the 10 city index was up 2.3% on a non-seasonally adjusted basis. Clearly, the 10 cities that are in the 20 city index, but not in the 10 city index pushed up the 20 city index’s growth rate. Specifically, New York prices were flat, Dallas was down 0.1%, and Chicago was down 0.2%.
San Diego and San Francisco jumped 0.7% monthly, but were only up 1.3% yearly. Along with Los Angeles’ 1.3% growth rate, they were at the bottom of the list. Las Vegas’ home price index was up 8.2% yearly which is down from its recent peak of 13.9% in August. That price growth was unsustainable. Las Vegas is still relatively strong compared to the national index.
Housing Price Growth Falls Slightly: FHFA Index
March FHFA home price index also was released on Tuesday. It showed monthly price growth fell from 0.3% to 0.1% which missed estimates for 0.3%. Yearly price growth fell from 5.1% to 5%, but February’s reading was revised up from 4.9%. March’s 5% growth rate is a 4 year low because of that revision.
Mountain states had the highest price growth at 7.1%. That’s because Denver has been a relatively hot market, although, all the hot markets have cooled off since last year. Mid-Atlantic had the worst price growth as it was 3%. That’s because areas like Washington D.C. and Philadelphia have seen weakness.
It’s important to keep in mind that this price data is from March. We saw solid purchase application growth in April. Also, make sure to understand my opinion on housing. 2018 price growth was high for most of the year before it tapered off in Q4. That was a disaster waiting to happen because consumers said housing wasn’t affordable and interest rates were increasing most of the year.
Now we have price growth and interest rates falling which are starting to make housing more affordable. That’s a recipe for improvement in the housing market in the intermediate term. There won’t be a big boom later this year, but the data will be much better in Q4 2019 than it was in Q4 2018.
Weak May Dallas Fed Reading
Housing Price Growth - The Empire Fed and Philly Fed manufacturing readings were strong. But ever since then a bunch of reports have shown weakness. Those readings were false positive indicators. There was no manufacturing recovery in May.
The chart below shows the 3 month moving average of all the regional Fed reports. They have all fallen this year, but the Dallas Fed was the worst hit. That’s the report I’m reviewing in this section.
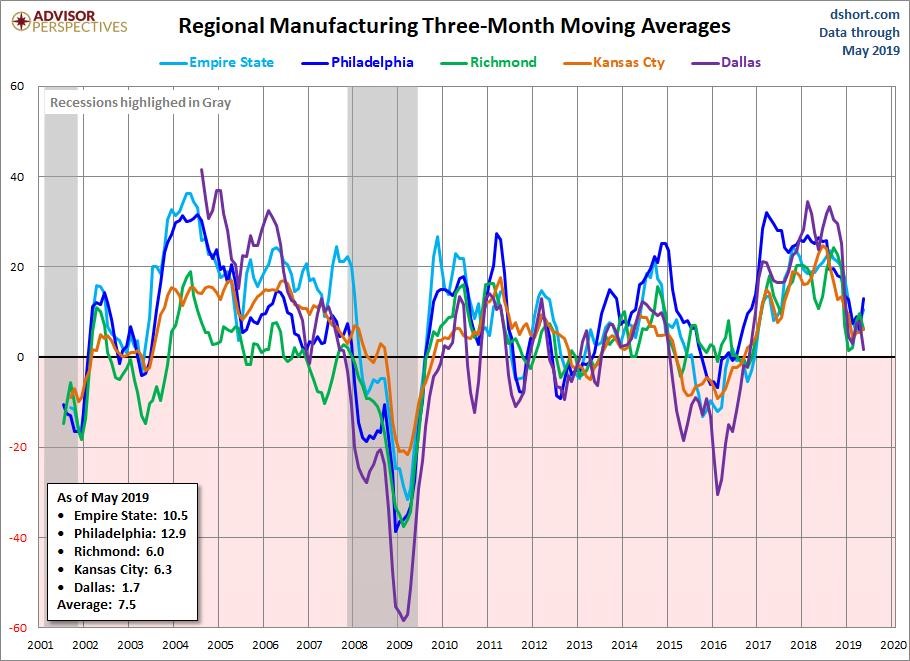
Dallas Fed’s production index fell from 12.4 to 6.3. Furthermore, the general activity index fell from 2 to -5.3. That missed estimates for 6 and the low end of the estimate range which was 5.0. This report had almost across the board weakness. New orders index fell from 15.6 to 7.7 and the growth rate of orders index fell 4.1 points to 1.1.
Capex index fell from 18.9 to 18.3. Company outlook index fell 8 points to -1.7. Finally, the outlook uncertainty index increased from 6.8 to 16.1.
Higher uncertainty likely was catalyzed by the trade war.
Housing Price Growth - 6 month expectations category of this report was also weak. The production index fell 4.8 points to 36.5 and the capex index fell from 26.2 to 22.8. Finally, the company outlook and the general business activity indexes fell 9.4 and 9.3 points to 11.5 and 9.1.
Data for this report was collected from May 14th to May 22nd. That’s after the tariffs were announced by President Trump on May 10th. Keep that in mind as I show the quotes from this report.
A machinery manufacturing firm stated, “China tariffs were already causing significant price increases, and the latest escalations will raise our costs even more—probably our prices, too—and make us less competitive on the world stage where we export 70 percent of what we produce.” This firm is in trouble as its ability to compete on the global stage will be hindered until the tariffs are removed.
A computer and electronic product manufacturing firm stated, “With our government’s intention to resolve issues with Iran and China and also introducing the “Deal of the Century,” it adds warranted risk to our future business that we can’t ignore.”
Biggest issue caused by the trade war is uncertainty. Businesses are like a deer in headlights. That partially explains the recent decline in manufacturing sentiment.