Housing Market Index - Oversold Stocks Fall Again
Many investors are no longer bullish on stocks even though they are oversold because the fundamentals look bad.
We got a reminder of those weak fundamentals on Monday. The new outlook has been working.
CNN fear and greed index showed “extreme fear” heading into the day and has been signaling stocks are oversold for weeks. Yet stocks still fell on Monday.
The CNN fear and greed index fell from 10 to 7 and the S&P 500 fell 1.66%. Based on the stock market simply pricing in the weakness expected by economists, the market should be down 10% to 15% from its September peak.
After that decline occurs, we’ll need to wait and see whether this slowdown will lead to a recession or a quick recovery.
Housing Market Index - Don’t Buy The Dip?
One of the most successful strategies in this bull market has been to buy the dip.
The biggest problem with that strategy last year was that there were no dips. This year’s market hasn’t been nearly as fruitful. S&P 500 is only up 0.64% year to date.
Even a Christmas rally won’t make this an average year for stock investors. Cash is outperforming stocks and bonds for the first time since 1992.
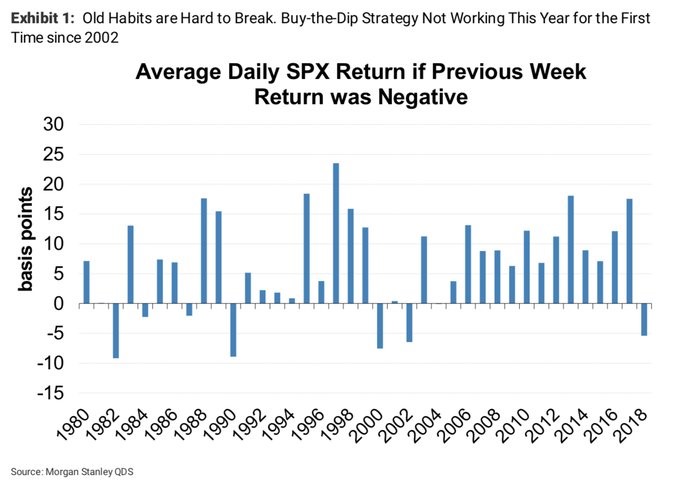
As you can see from the chart below, in 2018 the stock market is down on average after the previous week was negative. That’s the first negative performance since 2002.
To be fair, this isn’t the worst period in this bull market. S&P 500 fell 19.4% in its correction in 2011.
Housing Market Index - Tech Underperforms
Russell 2000 and the Nasdaq underperformed the S&P 500 as they declined 2.03% and 3.03%. VIX increased 10.8% to 20.10.
Tech stocks were destroyed. Nvidia fell 12% and Salesforce.com fell 8.7%. My timing on Facebook stock was wrong. It fell 5.72% to a new 52 week low.
The timing of Facebook’s bad year couldn’t have come at a worse time. Investors don’t like momentum growth names.
Personally, I think Facebook has become a GARP stock based on its multiple. But investors are fearful of regulations and users fleeing the platform.
Amazingly, according to the November Bank of America Merrill Lynch fund manager survey, only 18% of investors said they were net overweight tech.
That’s the lowest level since February 2009. That response is reflected in Nvidia’s 50% decline since October 1st.
Even during the upswing at the end of last week, the leaders of this cycle underperformed. Stocks can’t rally without the tech, communication services, and consumer discretionary sectors.
They fell 3.79%, 2.6%, and 2.71% on Monday. The two gainers were utilities and real estate which increased 0.52% and 0.52%.
Housing Market Index - Treasuries & Fed
The 10 year yield and the 2 year yield haven’t moved much. 10 year is at 3.06% and the 2 year yield is at 2.79%.
That means there has been slight steepening as the difference between the 2 is 27 basis points. The 2 year yield is now 18 basis points off its cycle peak.
Many bullish investors are using the yield curve to justify their optimism. However, that doesn’t protect investors against declines. As I mentioned, the S&P 500 fell 19.4% in 2011. The curve was much steeper then than now.
If stocks are down 15% because of a slowdown and you want to use the yield curve as part of a bullish thesis, it’s fine. However, there’s no reason to buy stocks now because of the normal curve.
Here’s a simple forecast. If the stock market is below the October low on December 19th when the Fed meets, it won’t hike rates.
The biggest data point that could affect policy is the October PCE report. If the stock market falls, the Fed could use weakening core PCE inflation as justification for not hiking rates. Currently there is a 70.6% chance of a rate hike in December.
If there is a hike in December, the market is only pricing in one hike in 2019. If everything goes according to plan, the rate hikes will end in 2019. If the economy and stock market continue to weaken, the last hike this cycle has already occurred.
Housing Market Index - Big Negative Surprise In Housing
The housing industry rallied as the ITB was up 6 basis points which is solid outperformance over the S&P 500.
Even though tech sold off while housing increased, I still think the shockingly weak housing market index played a role in the sell off on Monday.
The November housing market index came in at 60. That was way below the consensus and prior reading of 68. This was the lowest reading since August 2016. The low end of the expected range was 66.
When readings come in far away from expectations, the report is either a one-off event or a sign of a trend. Since the housing market has been weakening, I think this is a sign of the negative trend extending lower.
Future sales index fell 10 points to 65 which is the weakest reading since May 2016. Current sales index fell 7 points to 67 which is the lowest reading since August 2016. Traffic index fell 8 points to 45 which is also the lowest reading since August 2016.
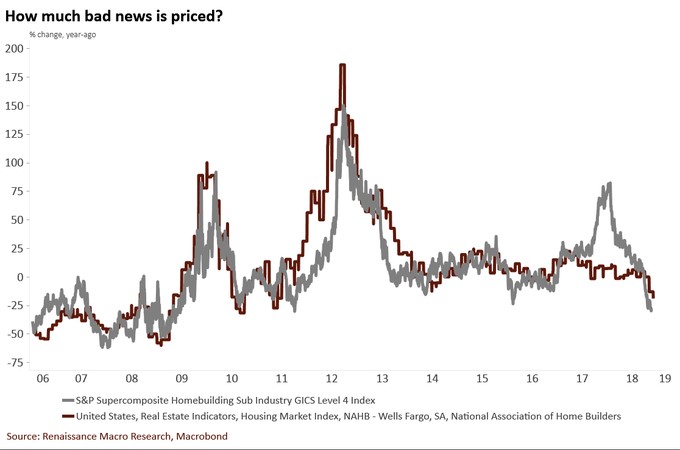
As you can see from the chart below, the bull case for the homebuilder stocks is this is priced in. The index is slightly below the housing indicators.
However, it’s not like the indicators are improving which would make them buys. There simply may be a temporary halt in the crash. That’s nothing to get excited about.
I doubt the housing market is anywhere near the end of this weak period because housing is still unaffordable. If the economy falls into a recession, there is much more room to fall.
Usually trends don’t reverse until the catalyst for it reverses. Therefore, either rates need to fall, as they have been doing recently, or price growth needs to slow. Prices need to become affordable again.