Hiring Increases In November JOLTS
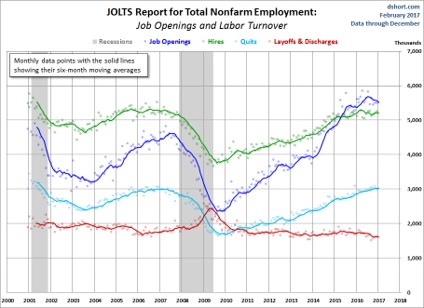
In October, openings increased and hirings plummeted; in November it was the reverse. Headlines say this was a bad report, but I say it was ok. You can see the long term historical trends in hires, quits, openings, and layoffs & discharges in the chart below. Hires seem to be in a range while openings seem to have peaked.
Yearly change in payrolls and openings are highly correlated. Since the JOLTS report is delayed a month, we shouldn’t be too surprised with the recent decline in openings. Yes, the November payrolls report was great, but yearly growth in job creation has been in a downtrend all year (2019).
Specifically, total job openings fell from 7.361 million to 6.8 million. Bulls will say openings are still significantly above hires. Bears will say this was the lowest number of openings since February 2018. Furthermore, the yearly growth rate fell from -3.8% to -10.8%. That’s the lowest growth rate since December 2009. Hiring means people actually got a job while an opening might never be filled.
That’s not to say we should completely ignore openings. If openings continued to fall and hiring stayed steady eventually openings would fall below hires which would limit hires. Because we aren’t near that point yet, I’m not hyper-focused on openings.
There are currently 979,000 more openings than hirings which is the lowest since February 2018. That’s still a very high difference since before the 2nd half of this cycle, openings were never above hirings. To me, it makes sense for openings to be above hirings. It’s tough to say what is normal because this data only includes 2 cycles as the report was started in December 2000.
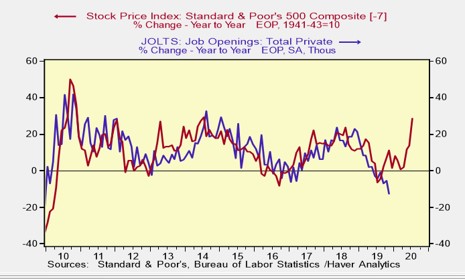
The chart below looks just like most macroeconomic data when it’s compared to the stock market. As you can see, the S&P 500 is up substantially on a yearly basis. This has been one of the best runs of the expansion. Job openings are obviously down yearly. As you can see, the 2 are correlated when the S&P 500 is pushed forward by 7 months. Openings need to increase in the next few months for the stock market to be proven right about this potential growth acceleration.
Where The Hirings Were
Charting is an opinion mixed with facts. That being said, hiring appears range bound. It has been range bound since Q2 2018. That’s better than openings. In November, hiring was up from 5.782 million to 5.821 million. That’s not a big increase, but anything that’s not a decline is a win in my eyes.
On the other hand, because this is from November which had a huge payrolls report, you’d expect more hiring than that. Yearly growth improved from -1.6% to 0%. We don’t need to worry about comps for this report. That’s not how it’s viewed. JOLTS report isn’t market moving. It gives us more detail on past results. It’s similar to when a report is revised.
Construction hiring fell from 488,000 to 423,000. This normalization is not a surprise because October had the most construction hiring since March 2007. Recently, non-residential construction spending has counteracted residential construction spending. I think with the huge spike in housing starts in December, construction hiring in this report will increase in December.
Of course, we already know that construction job creation was 20,000 from the BLS report, but JOLTS isn’t perfectly aligned with that. Retail trade had 773,000 hires which increased from 712,000 (the lowest since December 2017). Now it’s the highest since September. Finally, accommodation and food services hires fell from 937,000 to 898,000 which was the lowest since December 2018.
Retail and food services aren’t well-paying jobs, but it’s worth following them since in 2019 low paying industries had the highest wage growth. If there is less job creation in these industries, low paying wage growth could fall relative to the rest of the labor market. There might be a decline in low paying job creation because of the minimum wage hikes. I’ll be watching the January BLS report to see what happens. Overall quits rate in the JOLTS report stayed at 2.3%. That’s 0.1% off the cycle high. There’s not must to say here since there was no change.
Fewer Consumers See A Recession
Preliminary January consumer sentiment report from the University of Michigan fell 0.2 to 99.1 which isn’t a big deal. Current conditions index rose 0.3 to 115.8 and the expectations index fell 0.6 to 88.3. There’s not much to takeaway from this since there was barely any change. This isn’t like the Bloomberg Consumer Comfort index, which is at a 19 year high. But it’s also not showing pessimism.
Even though the impeachment was in the news a lot, with the House sending the impeachment articles to the Senate, only 1% of consumer mentioned it. This is a non-issue for consumers. Yearly growth in each part of the University of Michigan index was high because we are lapping the government shutdown, which was a big issue to consumers.
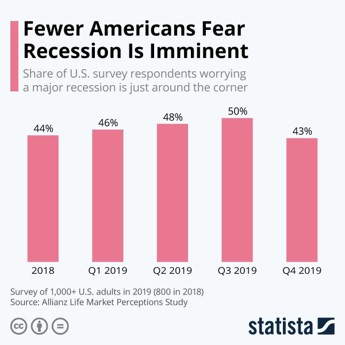
As you can see from the chart below, according to the Allianz Life Market Perceptions survey, in Q4 43% of consumers feared a recession was imminent which is down from 50% in Q3 and the lowest percentage since at least 2018. I’m not sure about how this question was phrased, but I consider that to be a high percentage even in Q4 considering that a recession isn’t around the corner.
This must be from what consumers read in the news because they are spending like a recession isn’t coming. December retail sales report wasn’t great, but it was very far from recessionary. You also don’t see 0% yearly hiring growth in a recession. The JOLTS report would be way worse.