Education And Healthcare Drive Job Creation
November jobs report showed 266,000 jobs created which was the most since January. 41,000 of the manufacturing jobs created were related to the ending of the GM strike. That means there really were 13,000 manufacturing jobs created which isn’t terrible.
ISM manufacturing employment index fell 1.1 to 46.6 and the PMI was below 50 again. This is another signal that the ISM report was too negative. Also, the ADP report showed the sector lost 6,000 jobs. The ADP report was very wrong in most aspects.
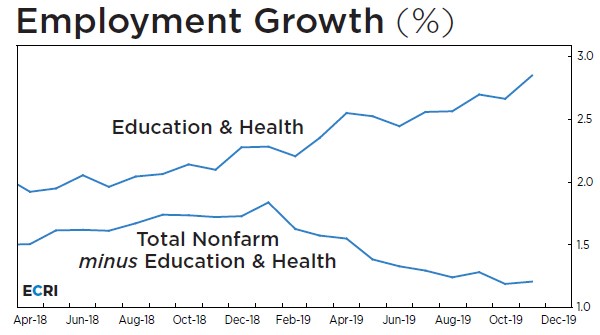
Education and health services industry created 74,000 jobs which was the most by far when you normalize the number created by manufacturing. Education and healthcare has been the best performer in the past year. As you can see from the chart below, healthcare and social assistance beat its 1 year average of job creation modestly and educational services beat it slightly.
Both segments usually do well when the economy weakens. They take share in recessions. This isn’t a new trend as the education and healthcare industry was 3.9% of the labor market in 1943 and it’s now 16.1%.

In previous reports, critics came for the leisure and hospitality segment as it was the driver of job creation. They had a good point. These jobs pay the least per hour. In November, they paid $16.77 per hour which is below the average of $28.29. Overall income growth won’t improve much if these jobs are added. It actually suppresses average hourly wage growth.
However, I wouldn’t say that has been a significant driver of the recent modest decline in overall average hourly wage growth. Production and non-supervisory wage growth has been strong. Manager wage growth has been falling; those workers get high pay. The criticism that leisure and hospitality jobs can be eliminated quickly doesn’t seem to hold merit as the industry has historically been in sync with the economy (not ahead of it).
A new bearish argument that education and healthcare are driving job creation which means the cyclical economy isn’t doing well is true, but I don’t see this latest data as a negative. Cyclical professional and business industry has seen job growth fall from 2.9% to 2.1%.
As you can see from the chart below, job growth without education and healthcare has fallen. However, why is this a bad thing? It’s not like the education and healthcare jobs won’t last. They actually have more staying power than jobs from cyclical industries. Plus, they pay well unlike leisure and hospitality. Average hourly wage is $27.81. If anything, this signals the labor market can handle economic weakness better because a growing portion isn’t cyclical.
A final point on which industries created jobs in November is that the information services industry did really well. 13,000 jobs added doesn’t seem like a lot, but it is the joint highest level since June 2016. Plus, these jobs pay $42.29 per hour which is the highest out of any industry.
The Labor Market Stays Relatively Full
Unemployment rate fell to 3.5% and the underemployment rate fell to 6.9%. Labor force participation rate fell 0.1% to 63.2%. However, that decline must’ve been related to demographics because the prime age labor force participation rate stayed at 82.8%.
Last cycle, it peaked at 83.4% and the cycle before that peaked at 84.6%. The age adjusted labor force participation rate is 20 basis points below the 1999 to 2000 average. Age adjusted employment to population ratio is above the 1999 to 2000 average.
These metrics show the labor market is at full employment. However, it can’t be at full employment because jobs are being created at twice the level necessary to keep up with population growth. This labor report supports the narrative that the decline in the average yearly growth rate was caused by cyclical weakness, not the fullness of the labor market.
You wouldn’t expect to see a 3 month average of above 200,000 jobs created per month with the labor market as full as it was in the late 1990s which was previously the longest expansion in a century. That expansion also had higher growth per year than this one.
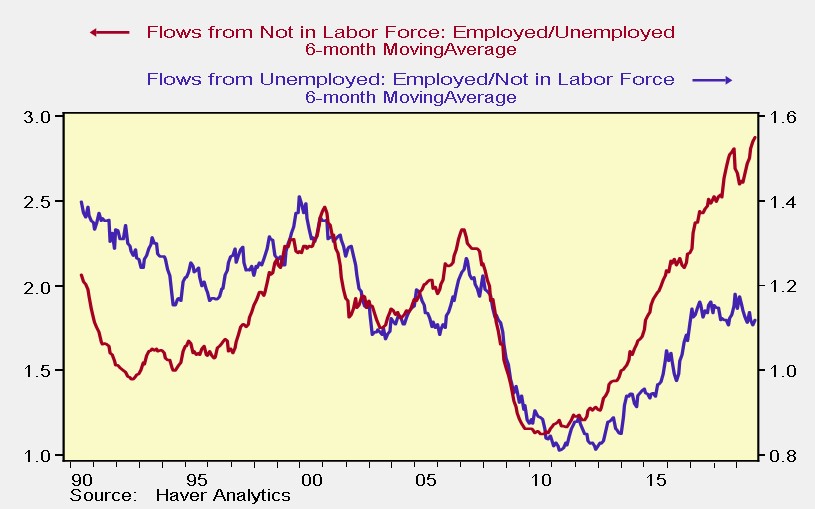
An answer to this confusion over where these workers are coming from is seen in the chart below. As you can see, flows of workers from not in the labor force has spiked while flows from unemployed has been stagnant for the past couple years. There aren’t many unemployed people looking for a job, but there are still some people who aren’t in the labor market who might get a job if solid pay and training programs are offered.
Job training is important for people who haven’t been in the labor force for years. Job training is worth the cost if there’s no other way to get employees. Job openings have routinely been above hiring in the past few quarters. Clearly, there is demand not being met by supply.
Very Good Real Wage Growth
October’s average hourly wage growth rate was revised up from 3% to 3.2%. November’s growth fell to 3.1%, but its 2 year growth stack improved 0.3%. Length of the average work week stayed at 34.4 hours. Weekly wage growth increased to 3.1% from 2.9% which was the highest rate since March.
Wage growth was very strong for every day workers. Production and non-supervisory wage growth stayed high as it fell 10 basis points to 3.65%. 2 year growth stack improved 13 basis points. This group represents about 80% of the labor market.
Because of the decline in inflation, real wage growth has accelerated for these workers. 5 year compound annual growth rate of real wage growth for these workers is in the 89th percentile since 1986. The 5 year CAGR in nominal terms is in the 78th percentile. Decline in inflation puts the cherry on top for this data point.