GE Unusual Option Activity
Over the last few weeks, the share price of General Electric (NYSE: GE) has been ripping higher. The movement comes as the company is set to announce their earnings on October 28 before the market open. Although the price has rallied over 30% during this period, it is still down over 30% from its 2020 high. As the earnings approaches, it appears some option traders are looking for more upside.
The idea of upside following a GE earnings may catch you off guard. Wasn’t this company swirling around a dark abyss in the spring?
One positive news story that came out a month ago was the announcement from the CEO Larry Culp. The CEO is guiding expectations of the company generating $2 billion to $4 billion in free cash flow in 2020. This is good news coming from a company that slashed their dividend at the end of 2018.

GE Option Activity
As of the time of this writing, GE call option volume is over 60% higher than its 5-day average. Over 49% of the volume has occurred at the ask price and over 50% is at a strike with a 0.40 delta or less. Taking a closer look at the activity, it was centered on two contracts. Here’s the details:
- 20,000 30 OCT 20 $8 call BOT @ $0.22 in two prints
- 20,000 6 NOV 20 $8 call BOT @ $0.31 in two prints
The October expiration has over 26,972 in open interest and has traded 33,640 at the time of this writing. The November expiration only had an open interest of 5,752, which reflects the long activity as also opening trades.
GE Expected Move
At a price per share of $0.22 and $0.31 for the October and November expirations reflects a breakeven stock price of $8.22 to $8.31. With seven days and 14 days remaining to expiration, the trade is pointing bullish movement share price of GE over earnings.
The options market is currently pricing in a $0.73 move in GE for next week. That movement is based on the expected move for the 20 OCT 20 option expiration. With a stock price at $7.67, that means a breakeven price of $8.40. The strike and expiration combination are certainly pointing to a larger-than-expected move higher over the earnings.
GE Charts
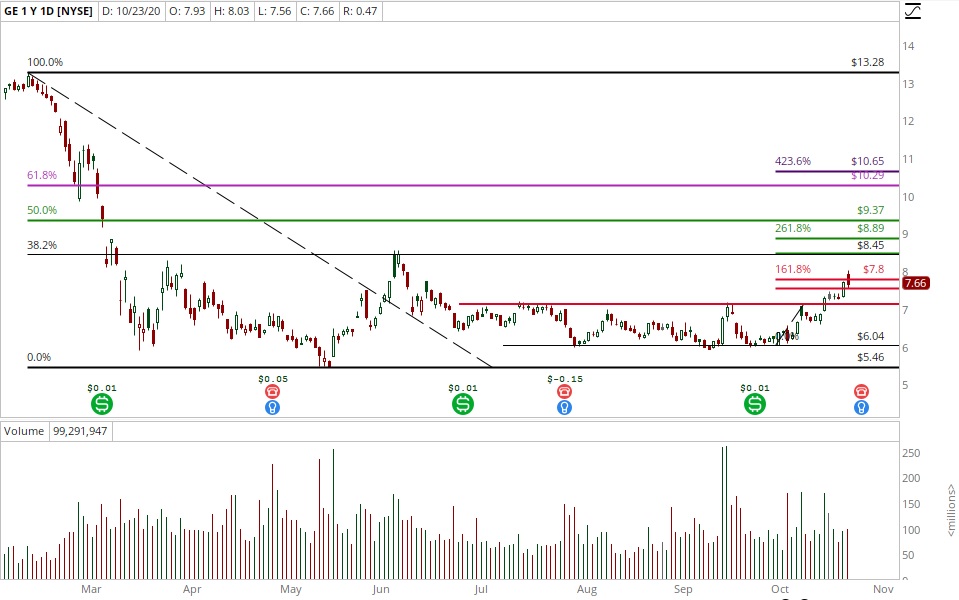
GE completed a major reversal pattern when it broke the $7.13 resistance on October 16 on significant volume. The price had been trading in a range between that level and the $6 support since July.
The first leg of the trend, or seed wave, from October 2 to October 9 setup the possibility of drawing Fibonacci projections. The 261.8% Fib projection is near $9 and the 423% projection is near $10.50. By drawing a Fibonacci retracement over the downtrend in February and March there are points of confluence. These levels indicate potential movement to $9 and $10.50. This is the indication provided by the historical movement in GE.
Conclusion
It’s an easy argument to make that GE is a broken company and a bad investment. However, that would overlook the trading opportunity that has been apparent over the past few weeks and the possibility the company is seeing its fundamentals improve. Afterall, an improved outlook can be a strong factor for buyers and the company has a chance to show it on October 28. At least some option and stock traders appear to be lining up for that possibility right now.
Learn how to deal with uncertain markets by learning about the Vomma Zone. Not a subscriber? Become a TheoTrade member.