
No New Record High Again
S&P 500 once again didn’t surpass its June 8th high as some have been predicting it wouldn’t. There have been a few nights where the futures market suggested a new high was coming, but the cash session has yet to deliver. While flirting with this level, it simultaneously flirts with going positive for the year. There are so many uncertainties in the next 5 months, it’s incredibly difficult to tell if it will end the year in the green. On Thursday, the S&P 500 fell 0.34%, the Nasdaq fell 0.73%, and the Russell 2000 fell 0.72%.
Nasdaq has been underperforming for a few days. If it falls on Friday, it will finally end its near record long streak without back to back declines. Tech has been underperforming this week. Nasdaq 100 is down 2.7% and the S&P 500 is up 0.6%. That makes this the worst relative week for the Nasdaq since May 2009.
Obviously, it’s way more pleasant for tech investors to underperform a flat market than a down one. Had the S&P 500 fallen 2% this week, it would have been a bloodbath. Even still Amazon is down 4 days in a row in which it has declined 6.25%. We are approaching earnings season for most of the big internet firms along with the Congressional hearing on the 27th.
Scary Sentiment Reading
CNN fear and greed index stayed at 62 which is greed. The market isn’t overbought if you’re just looking at the past few days, but many view it as expensive in the wake of the economic slowdown. Bulls are betting on stimulus prospects which are highly uncertain. We will likely get information on a concrete plan within the next 3 weeks. Soft deadline is July 25th which is when the federal unemployment benefits run out.
Most weren't expecting this to be a hugely important NAAIM reading, but it was. For the 2nd time since the bear market, the exposure index rose above 90 which is a bearish sign. It rose from 85.09 to 90.53 which is slightly below the peak of 91.6 which was right before the huge one day correction.
It's unlikely that we will have such a big one day decline just because the NAAIM index is elevated again. However, this lowers the odds the S&P 500 will pass the June 8th peak. There will likely be added volatility in the next 2-3 weeks because of earnings season and the debates about the next fiscal stimulus.
Retail Traders Are Still Here (And Bearish?)
AAII sentiment reading has confounded many observers for the past few months because it has been so bearish during one of the greatest rallies of all time. Plus, we know retail traders are going all in on this market. Percentage of bears in the AAII reading has been more than 1 standard deviation above its long term average for 17 of the past 20 weeks.
This survey normalized slightly this week as the percentage of bulls rose 3.7% to 30.8% which is 7.2% below average. Percentage of bears, however, also rose. It was up 2.7% to 45.4% which is 14.9% above average. Percentage of neutral investors therefore crashed 6.4% to 23.8%.
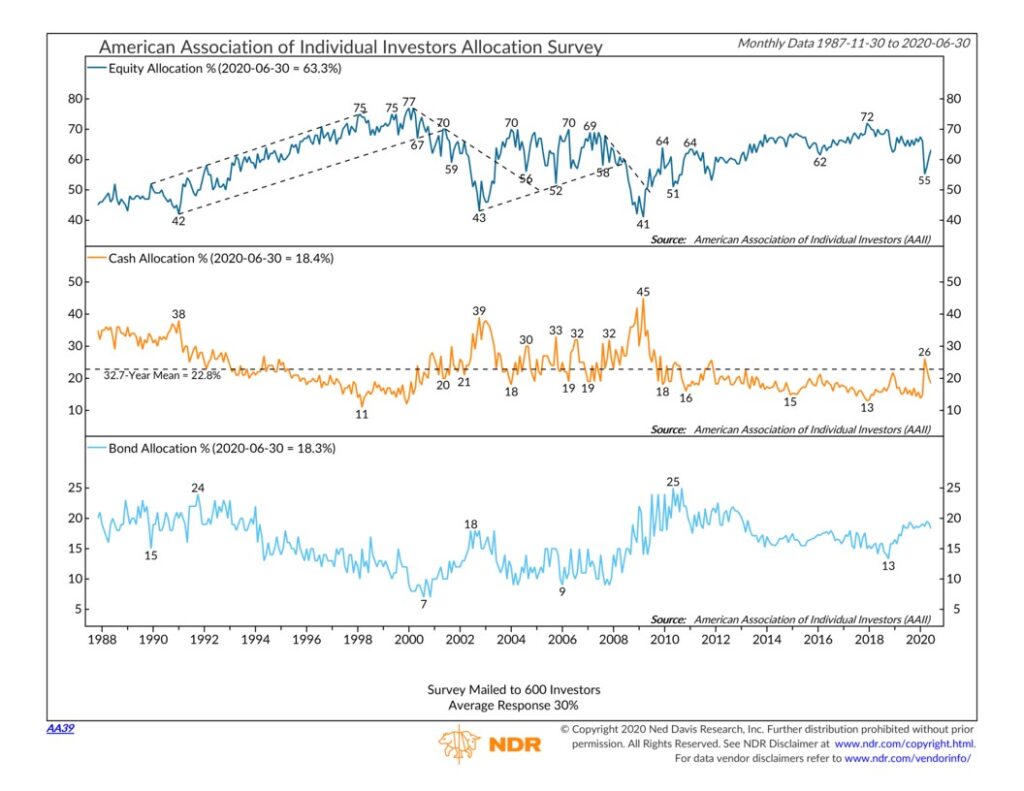
Many investors are likely buying stock because there is no other option even though they are saying they are bearish. The chart above shows equity allocation is 63.3% which seems normal. Even though retail traders have come storming in like the late 1990s, the percentage is still below the peak of 77% in the late 1990s. Cash allocation is 18.4% which is slightly below the long term average of 22.8%.
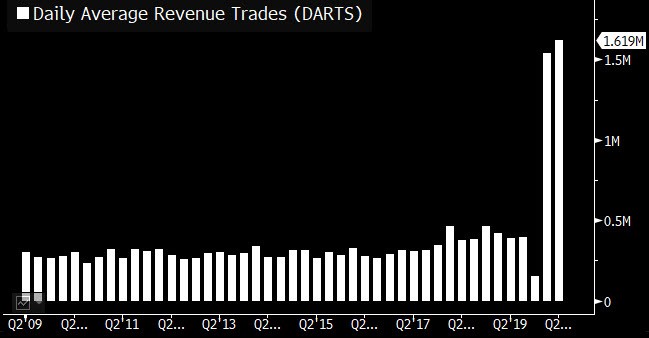
As you can see from the chart below, retail trading increased slightly in Q2. Judging by the Robinhood numbers, it looks like most new accounts were opened in the spring. Almost everyone who would have gotten on board has done so. New investors who are creating accounts now are part of the FOMO trade. The chart shows there were $1.6 billion in daily average revenue trades.
Because there hasn’t been much volatility outside of one day in early June, we wouldn’t have expected DARTS to fall. There aren’t as many new accounts being created, but few left. It’s actually impressive there was this much revenue because the decline in volatility probably caused there to be fewer trades per person.
Another Crazy Tech Chart
We have gotten used to the crazy Nasdaq and tech charts in the past few weeks that have compared this market to the late 1990s. All we have gotten so far is modest corrections in the biggest tech names. A few hot stocks have crashed, but that isn’t a big deal.
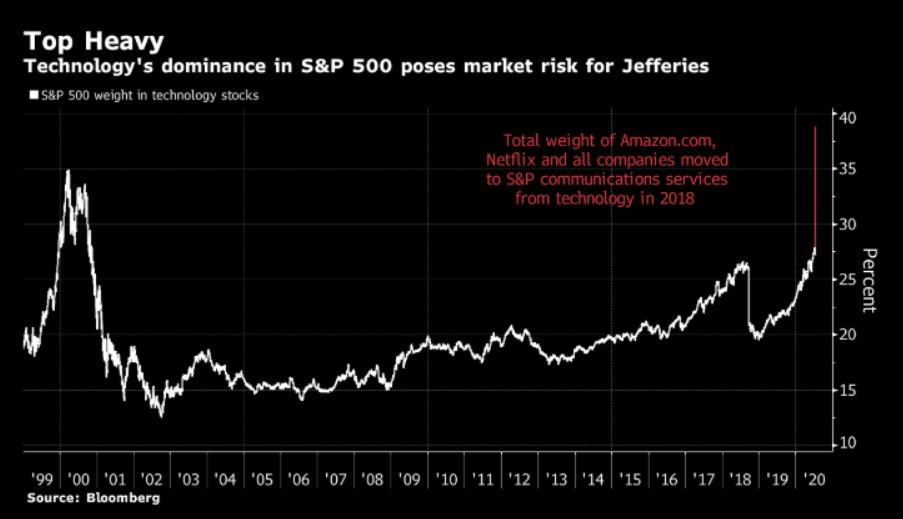
For example, Shopify is down 11% since July 9th. It’s still up 13.2% in the past month though. The chart below is another crazy chart. It shows that the S&P 500’s tech weighting would be above the peak in 2000 if all the companies recently moved out of tech were put back in.
Weak Netflix Earnings
First FANG stock to report, Netflix, had disastrous results. That’s because everyone created accounts in the spring during the quarantine. Few needed to create an account starting in June. Shutdowns ended in the quarter and there hasn’t been new original content added for months. All filming shutdown, which helped free cash flow, but hurt net subscriber adds.
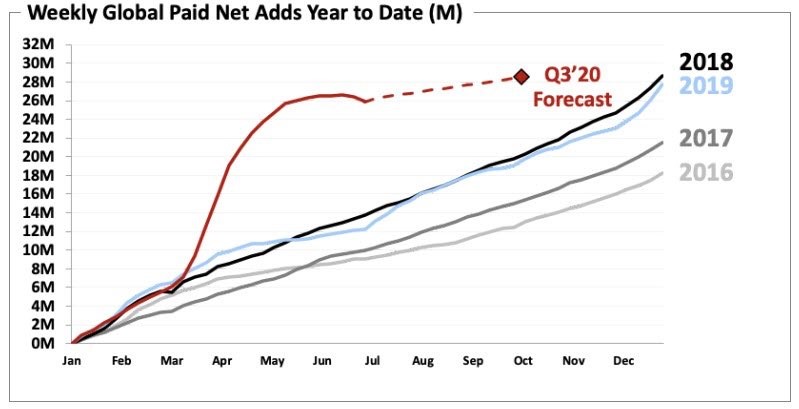
Specifically, the firm reported $1.59 in EPS which missed estimates for $1.81. It had $6.15 billion in sales which beat estimates for $6.08 billion. Global subscriber adds were 10.09 million which beat estimates for 8.26 million. As the chart above shows, growth slowed at the end of the quarter. The firm is predicting that slower growth will continue in Q3.
NFLX expects to add only 2.5 million subscribers which missed estimates for 5.27 million. This weak guidance caused the stock to fall 9% after hours. The firm added most of its new subs for the year from late March to the end of May. It will still likely be a better year than the