

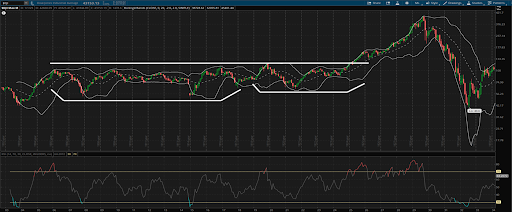
It never ceases to amaze me - how sentiment follows price. Stocks dropped six weeks’ worth of gains from their all-time highs down into what appears to be a low of significance this past Monday.
This was also the longest decline that stocks have experienced going back to the October 2023 low. Ask yourself this question: Was that a good time to be buying stocks?
I’ll be honest with you: I think the permabears are in for a lot of pain in the coming weeks. It’s always very telling to me when I start seeing comparisons to “a collapse along the lines of the Great Depression.”
It actually gave me this idea: Let’s run the math on how the market behaved during those Roaring Twenties.
I think you’ll be surprised. After all, the numbers never lie, only the anonymous social media permabears do. Check this out… (JUMP)
The Numbers Behind the Roaring Twenties Mania
The Roaring Twenties have taken on a mythological status in U.S. economic history. At this point, there’s probably nobody left alive that actually traded during that time. Fortunately there are numerous people who’ve written about their experiences trading through that period of time.
That said, I find it better and more enlightening to look at the actual numbers that led to arguably the greatest stock market mania in American history.
Here is a monthly chart of the Dow from 1903-1993.
If you tune into TheoTrade's live room, you often hear me say, “When in doubt, zoom out.” One of the first observations here is how long stocks consolidated before embarking on the bull run in the 1920s. They were basically range-bound from 1906-1925 - that’s quite the consolidation.
Now, my fellow Trinity Traders are probably eyeing the remarkable price pattern during that 19-years period: What a breakout that followed!
But let’s get into the numbers now, starting from a few key points.
From the December 1914 low to the 1929 high, the Dow rallied 625%. That’s pretty impressive for a 15-year period. For comparison, we’re currently up around 565% from the March 2009 low, but obviously, we’ve followed a much different path from what we saw in the 1920s.
Now let’s look at the rally from the August 1921 low, which kicked off the Roaring Twenties. The Dow appreciated 503% from that low into the September 1929 high. That’s a spectacular rally for an eight-year period.
Now let’s compare this to the last decade or so in the Dow. If you recall, we had some market turbulence in 2015 and 2016. If we use the August 2015 low, which was just under a decade ago, we’ve only rallied around 180%.
Does that seem like a market mania to you?
Now let’s look at the March 2020 low in the Dow - we’re only up around 135% from that low.
Again, does that seem like a market mania to you?
I’m not trying to give you an answer here. I simply want you to ask the right questions.
But if you were to ask me, I would say that we have a lot more mania to come before we enter a Great Depression-style market crash.
I’ll be discussing this in more detail during today’s live session here at TheoTrade. Be sure to tune in!
Talk soon,
Gianni Di Poce
THEOTrade