Stock Market Still Overheated
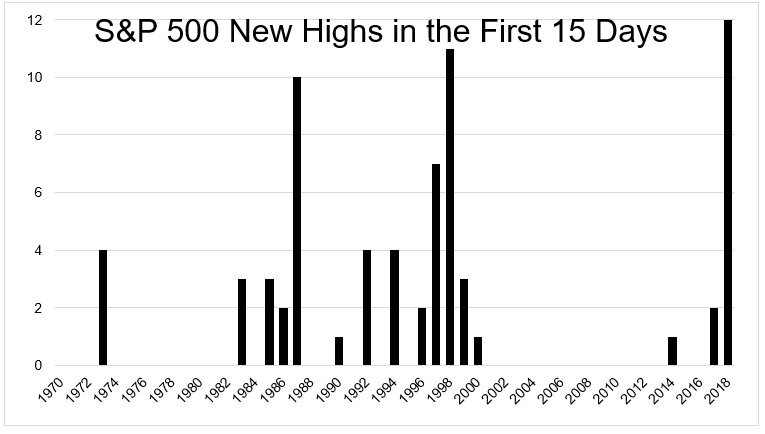
There have been many odd records this year which you normally don’t hear about. That’s what happens when the S&P 500 hits a new record almost every day. I’m not exaggerating with that statement. As you can see from the chart below, the S&P 500 hit a new high in 12 out of the first 15 days of the year. It’s the highest number of new highs since at least 1970. I wouldn’t necessarily trade off this information because many years the market didn’t start near a new high, so it wasn’t possible to achieve such performance. This is just another piece of information which shows the market is in a euphoric stage. Adding to this point, the S&P 500 has been above the 200 day moving average for 396 days. That’s the 2nd longest streak since 1957. The longest was 475 days from 2012-2014.
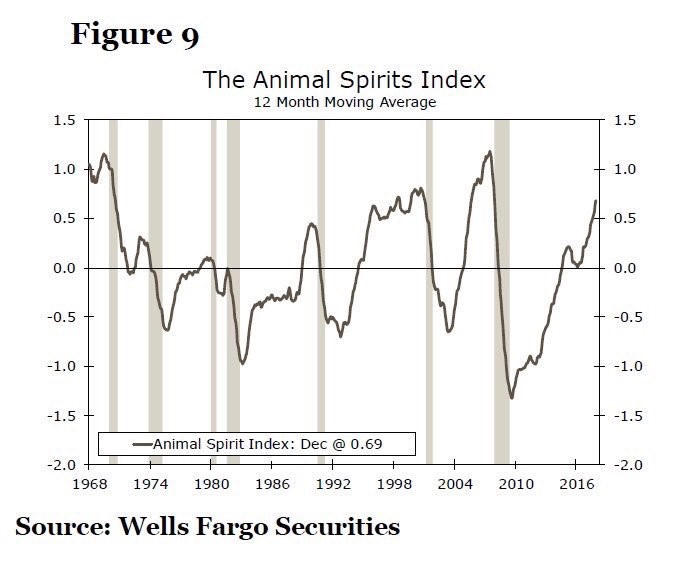
The chart below shows the Wells Fargo Animal Spirits index which, unsurprisingly, is near the highs seen before previous recessions. We’re at an unusual place where I see investors begging for a correction. If you are bullish on the economy and earnings, you want stocks to go up slowly and have normal corrections. The speculation in stocks is probably the biggest potential catalyst for a sharp correction since earnings estimates are headed higher and global trade growth has been strong. There’s a sinking feeling that volatility is like a spring, where this extremely placid action is about to lead to a bout of volatility. The fact that so few investors have witnessed any meaningful correction can cause a knee jerk reaction to a sell off. If selling catalyzes more selling, the market can easily fall 10% or more. It’s not as if valuations would be compelling after stocks fell 5%. The main trade is based on momentum. When it ends, the house of cards could crash even without a recession.
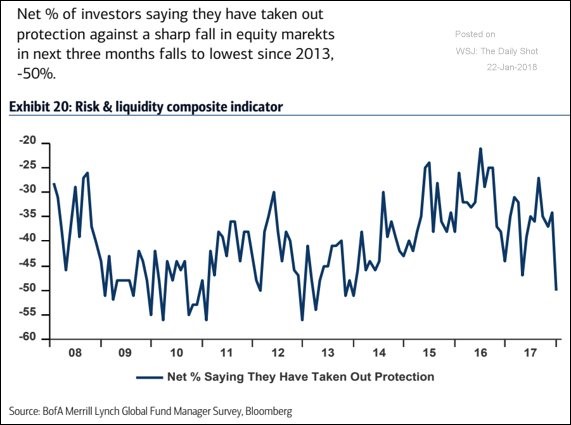
One way to spook investors would be a sell off in which most of them don’t have protection. As you can see in the chart below, that’s the exact situation we find the market in as the net percentage of investors who said they have taken out protection against a sharp correction in equities has fallen to the lowest level since 2013. Investors only decide to buy puts after they need them. As you can see, put buying was high in 2008 and 2016. The one time this wasn’t a contrarian indicator was 2009. That was the beginning of the bull market. The current market is far from that.
The S&P 500 is off to its best start in 31 years. When the S&P 500 has been up 5% or more by January 23rd, the median gain for the rest of the year is 11.6%. The problem with all these bullish stats which come after good runs is that they are based on the market continuing its momentum. Statistically momentum is going to always look like it will continue because everyday it continues counts as a data point while the end of the momentum only counts as one data point.
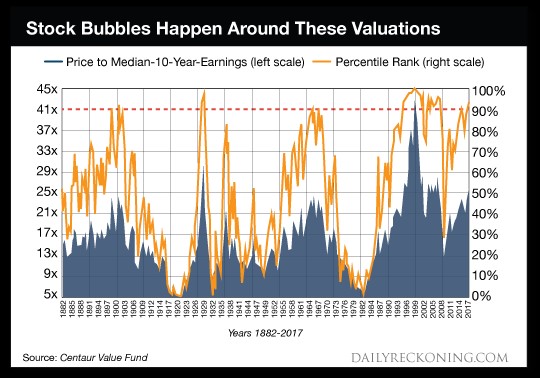
As you can see from the chart below, the current market is above the 90th percentile for the price to median 10 year earnings ratio. The median is less impacted by the extremely low earnings in 2008 that CAPE earnings are hurt by. This indicator still shows stocks are expensive. They’re only slightly more expensive than average if you look at future results, but eventually the optimistic estimates aren’t reached. I’m not saying that will occur in 2018, but when it does occur, there’s a long way to fall based on these high valuations.
Coordinated Manufacturing Slowdown?
As I mentioned in previous posts, the Empire Fed index and the Philly Fed index have shown manufacturing has been weakening with a sharp drop off in January. The same result was published in the Richmond Fed survey. The January report showed the composite index fell from 20 to 14. The December index was down from 30 in November which shows how far it has come. The situation has gone from great to good.
On the bright side, the new orders index was flat at 16, but in November it was at 35. Shipments fell sharply to 15 from 24 after falling from 33 in November. The overall economy has been seeing an increase in the capacity to utilization rate as the December report shows it’s at 77.9% which is nearing the cycle peak of 79.2% which was in November 2014. The Richmond Fed capacity to utilization index shows a different story as the index fell from 19 in November to 16 in December to 13 in January. Unlike the other two manufacturing reports, the prices paid and prices received indexes were weak. The prices paid index was flat and the prices received index fell from 1.27 to 1.18.
Markit Flash PMI Also Shows Weakness, But In Services
The Markit flash PMI for January also showed weakness, but it was centered in services, not manufacturing. The composite index fell from 54.1 to 53.8 which is an 8 month low. The services index fell from 53.7 to 53.3 which is a 9 month low. On the other hand, the manufacturing PMI increased from 55.1 to 55.5 which is a 34 month high. The commentary said manufacturing did well partially because of the weak dollar. It said the overall index weakness is probably transitory because the forward looking survey shows optimism. I agree with this point. I expect the second half of 2018 to be stronger than the first half based on the ECRI forecast. Unlike the regional Fed surveys, this one showed new orders hit a 5 month high. Inflation was up the 2nd most since 2015. This is consistent with the Empire State and Philly Fed index. The manufacturing and non-manufacturing ISM reports will give us a better idea of which survey is correct. The industrial production report will give us the final information on the economy. The changes are usually priced into the market by the time that is released.