Is The Market Volatile?
Your fear of the current market action is dependent on your experience. If you don’t have a lot of experience in the market, you may be afraid, but this has been a normal year. I made the prediction late last year that this year would be more volatile than 2017. That was based on my expectation of less gains and a reversion to the mean of volatility. One big lesson which needs to be repeated is if you don’t have experience investing in volatile markets it doesn’t mean you can’t do it successfully.
Furthermore, if you have experience, it doesn’t make you an expert. The perma bears love to discuss how many young or new investors haven’t seen a bear market, but keep in mind that seasoned professionals make bad mistakes and underperform often as well. Also, it is always impressive to make money in the market and to beat it. Don’t let people talk down your returns because they occurred during a bull market. The stock market is on a bull run most of the time.
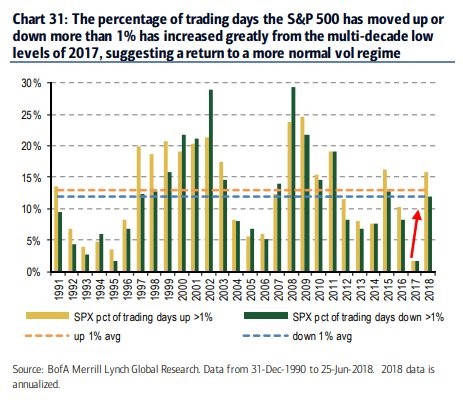
The chart below shows the increased volatility in 2018 compared to 2017. As you can see, the percentage of days the S&P 500 has been up more than 1% is a bit above average and the percentage of days the S&P 500 has been down more than 1% is average. It’s notable how whenever there is volatility to the downside, there are also large upswings. In bull markets, the market goes down quickly and up slowly. In bear markets, the market crashes even quicker and rallies fast as well. Dip buyers look smart for a short time in bear markets and then get crushed. To answer the question header, the market has been about average in 2018. Due to recent weakness, the returns have been below average.
Financial Conditions
According to the Chicago Fed National Financial Conditions index, the financial conditions are very close to the easiest of this expansion. It’s notable that the conditions bottomed and started getting more stressed before the market topped in January. The conditions bottomed in November 2017 and were stressed slightly more in January. There were so many negative signs in January that it’s difficult to say this one was strong enough to make you sell. The good news is that the stress topped out in March/April and has gotten easier since. This indicator was great last cycle because it soared in the summer of 2007. It might not soar as much in the next recession because it didn’t in the prior two as those weren’t financial crises.
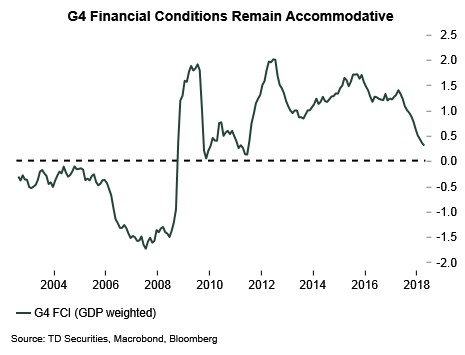
The chart below shows the G4 Financial Conditions index. The G4 countries are Germany, Brazil, India, and Japan. Germany is seeing weakness in exports because of weakness in China. Japan’s latest Markit manufacturing PMI shows growth isn’t slowing like Europe. Europe’s PMI is at a 19 month low as it fell to 55. Japan’s PMI is 53.1 which is up from 52.8 last month. Japan’s GDP growth is expected to be positive in Q2 again after the weakness seen in Q1 which ended a long string of growth.
Brazil is the walking dead economy as it hasn’t seen rapid growth in this recovery period after the 2015-2016 depression. This recovery is worse than America’s considering Brazil is an emerging market economy which is supposed to be advancing quickly. Q1 GDP growth was only 0.4%. From mid-May to mid-June the Brazilian stock market cratered 19%. It has stabilized in the past 2 weeks.
The Indian economy is the only one in this group which is doing well as GDP growth expanded from 5.6% in Q2 2017 to 7.7% in Q1 2018. The economy has mostly recovered from Modi’s demonetization. The fact that Brazil is doing poorly, and Germany is showing weakness explains why the G4 Financial Conditions index is weakening. It still is accommodative, but the indicator is closing in on the flat-line.
America Is Alone
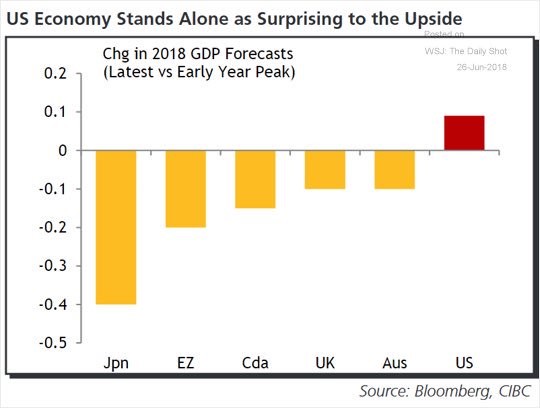
The chart below shows America is one of the few countries where economic projections have improved. Since the early year peak, American GDP growth estimates have increased by about 0.1%. The other countries listed below which are Japan, the Eurozone, Canada, the U.K., and Australia all have seen declines. Japan is down 0.4% because Q1 GDP contracted. As I mentioned earlier, there are signs of life in Japan, so I wouldn’t count out a moderate reversal in the second half of 2018. The Eurozone has had a bad year just as the ECB has started normalization.
American GDP is estimated to grow 3.9% in Q2 according to the average of the 11 models picked by CNBC. The range of estimates is in between 3.4% and 3.7%. We will get an update of the Atlanta Fed’s model on Wednesday.
Obviously, the tariff talk has dominated headlines and has moved the market considerably. The evidence of the effects of the tariffs on the economy are still sparse because they are new. The latest consumer confidence report gives us another data point to review on this issue. The west north central region of the country which includes Minnesota, Iowa, Nebraska, Missouri, North Dakota, South Dakota, and Kansas, saw consumer confidence fall 22.6 points. These countries are large soybean producers. China recently put a tariff on soybeans to counteract Trump’s recent tariffs. The good news is this effect can easily be reversed if the trade skirmish ends. The bad news is it seems clear the economy will weaken in the next few months if no deal is made.
Overall, the consumer confidence headline was 126.4 which missed the consensus for 128.1 and last month’s revised report of 128.8. The expectations index fell 4 points to 103.2. This weakness may have also been tariff related. Income expectations saw a decline in optimism from 21.4% to 18.8% and an increase in pessimism from 8% to 8.7%. The percentage of stock market bulls was up 4 points to 42.4%, while only 23.5% of those surveyed were bears. I’d rather the consumers be negative on stocks since they tend to have recency bias.