Slight Improvement In Richmond Fed Manufacturing Index
The May Richmond Fed manufacturing index increased slightly from 3 to 5. That missed estimates for 6, but considering the weak results from the Dallas Fed and Kansas City Fed, this shouldn’t be a disappointment. As you can see from the chart below, the 3 month moving average fell. Shipments increased from -2 to 2 and the volume of new orders increased from -2 to 0. The indexes with the biggest increases were raw materials inventories and wages which both went up 13 points to 37 and 38.
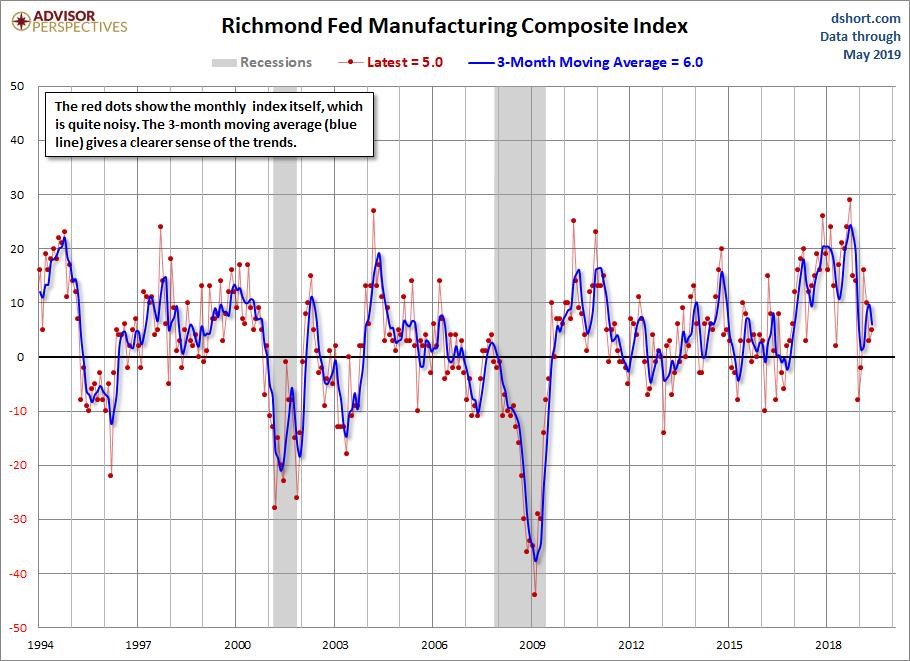
It’s good to see wages up, but it’s not great to see raw materials inventories up as it could mean demand isn’t meeting expectations. The availability of skills needed index fell 12 points to -20. There has been a huge problem with finding labor in the manufacturing sector. It’s talked about less now that yearly demand growth is falling. If growth turns negative, there will be layoffs which will increase the supply of skilled workers. Obviously, the better way to improve supply is to train workers, offer higher pay, and have the labor force increase through people coming off the sidelines and population growth. The biggest decline in this report was in vendor lead time which was down 13 points to 0.
8 of the sub-categories rose and only 3 fell. This report is better than the headline index indicates. However, on the negative side, the 6 month expectations index showed declines. The shipments category fell from 49 to 27 and the volume of new orders index fell 10 points to 30. Five categories saw increases and 6 saw declines. The good news is services capex increased 8 points to 14 and equipment and software spending increased 9 points to 33. I’m not surprised manufacturing firms aren’t optimistic about their future production. The global economy is slowing and the trade war is getting worse.
Q1 GDP Growth Revised Slightly Lower
Q1 GDP growth was revised from 3.2% to 3.1% which beat estimates for 3%. This wasn’t a great quarter when you delve into the details. Real consumer spending growth was revised from 1.2% to 1.3%. That’s still not a good reading. As you can see from the table below, personal consumption expenditures added 0.9% to GDP growth which is an 8 basis point improvement from the advanced reading. Residential fixed investment growth was -3.5% which is 0.7% lower than the initial reading. As you can see, it hurt GDP by 13 basis points instead of 11. Business investment was revised down 0.4% to 2.3%.
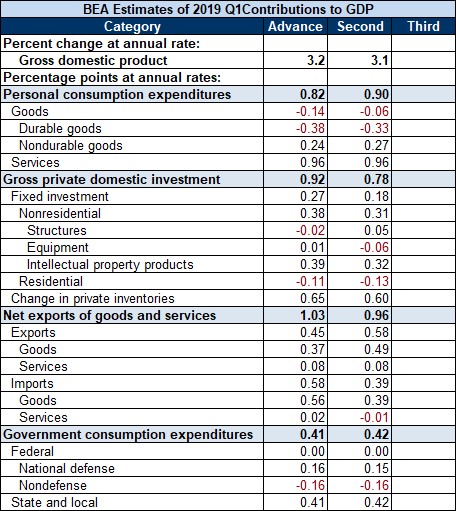
This report was weak because growth was driven by trade and inventories. Inventories went from helping growth by 0.65% to 0.6% and trade went from helping 1.03% to 0.96%. Personally, I love to follow the first revision to GDP growth because it comes in a relatively timely matter and improves the accuracy of the numbers. By the time we get to the 2ndadjustment, changes are usually smaller and the quarter is long gone. We still don’t have a complete understanding of where Q2’s growth rate will be other than that headline growth will be weaker than Q1. The excuse that Q1 was weak because of seasonality should hold no water since Q2 will be weak.
Inventories & Trade
The April wholesale inventories report showed 0.7% monthly growth which beat estimates for 0.3% growth and the prior reading which had no growth. This is important because many assumed inventories wouldn’t help growth in Q2 after they helped growth so much last quarter. Another theory is that there was pre-buying before the tariffs went into effect. Since the tariffs were announced in May, we need to wait for the next report to determine the veracity of that thesis.
The April trade report looks much less helpful to Q2 GDP growth as exports fell 4.2% after rising 1% in March. Imports only fell 2.7% after rising 1.6%. This caused the trade deficit to increase from $71.4 billion to $72.1 billion. Capital goods orders fell 6.5% monthly and 3.7% yearly to $44.3 billion. Auto exports fell 7.2% monthly and 6.7% yearly to $12.9 billion. Imports for capital goods, autos, and consumer goods fell 3.5%, 3.1%, and 2.3% monthly. The weakness in autos is no surprise as the auto industry is the weakest part of the economy.
Q2 GDP Growth Looks Grim
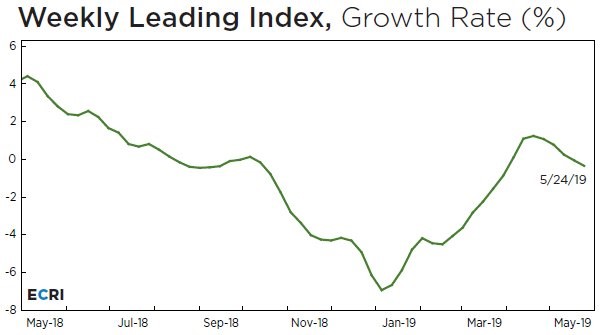
The economy is in bad shape and might get worse in Q3 if the ECRI leading index is accurate. As you can see from the chart below, the leading index had the sharpest declines in early 2019. This indicator leads the economy by 2-3 quarters. Growth recovered throughout the year as the index was helped by the stock market. The recent correction in stocks has pushed growth lower again. In the week of May 24th, growth fell to -0.3% from -0.1%.
Estimates for Q2 GDP growth are falling fast as the odds of growth being below 2% have increased. The CNBC median of 8 estimates shows growth will be 1.6%. The St. Louis Fed bizarrely expects 3.15 % growth. The NY Fed Nowcast improved 7 basis points to 1.48%. It was helped by the PCE report which I will delve into in a future article. Finally, the Atlanta Fed’s Nowcast sees growth of 1.2% which is down from 1.3%. The estimate for personal consumption expenditures growth increased from 1.99% to 2.03% and the estimate for non-residential equipment investment growth fell from 0.7% to -1.4%.
Conclusion
The manufacturing sector is likely doing poorly. The Richmond Fed index’s slight improvement doesn’t change my outlook. Q1 GDP growth was strong, but the details of the report were weak. The April inventories report will help Q2 GDP growth and the trade data will hurt growth. Q2 GDP growth will likely be below 2%. The ECRI leading index’s growth rate has fallen with the stock market. That means the potential recovery in early 2020 won’t be very sharp. At this point, investors should be more concerned with this year because of the disappointing economic results.