ECB Balance Sheet Decision Made
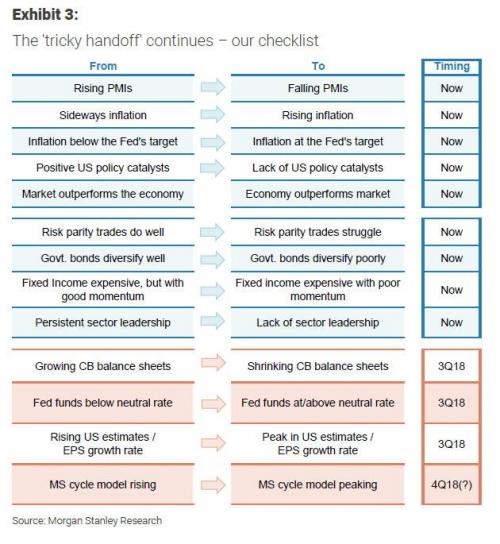
I’ve reviewed all the parts of the bear market checklist above which are currently occurring. Now let’s review the parts of the checklist which will occur in the rest of 2018. The first one is growing central bank balance sheets will transition to shrinking balance sheets. This is probably true because after the ECB’s meeting on Thursday the central bank announced it will be tapering its bond buying from 30 billion euros per month to 15 billion euros per month in September; then 2 months later in December it is ending the bond buying program.
With the European economy slowing, some were considering the possibility that the ECB would delay the end of the asset purchases. In terms of the past few months of data, politics, and central bank policy, this is slightly aggressive. However, compared to America this has been delayed for a while as the Fed buying program ended about 2.5 years ago. The Fed has been winding down its balance sheet for 8 months. The European economy seems to be more reliant on ECB purchases because the ECB purchased corporate debt and Italian government debt which is critical during bouts of political instability which occur often.
Fed Unwind Speed To Peak In October
The timing of the central bank balance sheet shift is also correct as the ECB will be buying only 15 billion in euros in September and the Fed’s balance sheet will be declining $40 billion per month from July 2018 to September 2018. Starting in October, the peak rate of $50 billion per month will be put in place. There have been discussions about when the unwind will end. I have always expected it to end in 2019 or 2020 because the economy will be under duress. The assumption that the Fed will shrink the balance sheet from $2.5 trillion to $3 trillion might prove to be too aggressive.
The big point which appears to be ignored by the prognosticators who claim volatility will occur because of these future balance sheet changes is that much of them have already occurred. The ECB has gone from expanding the balance sheet from 80 billion euros per month to 30 billion per month and the market already knows the end of the program is near.
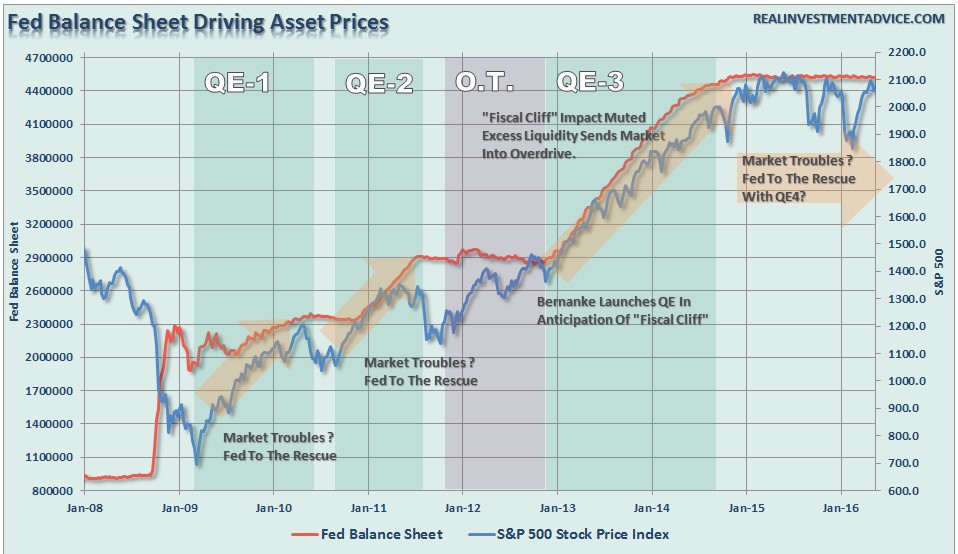
There were predictions that the end of the Fed’s QE and the balance sheet unwind would cause the markets to crash. The chart below shows an example of the charts which claimed volatility was coming in the 2nd half of 2016 and 2017. As you can see, forecasters claimed the markets would be in trouble. Furthermore, they figured the Fed would come to the rescue by doing QE 4. Those were wrong predictions because the Fed’s QE hasn’t been the principal reason for stock market returns. The stock market is up because earnings growth has improved as margins are near their record high.
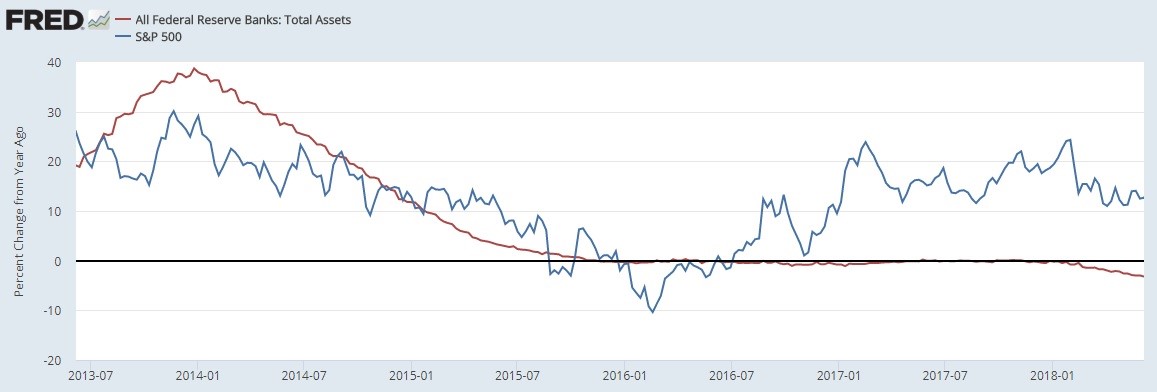
The stock market did fine after the Q1 volatility in 2016. The market had one of its best risk adjusted return years ever in 2017 even though the Fed didn’t do QE and started the unwind in October. The chart below compares the year over year S&P 500 performance to the Fed’s balance sheet changes year over year. As you can see, there has been a strong divergence in the past two years as the bearish prognosticators realized correlation doesn’t equal causation. The stock market had volatility in February 2018, but that has calmed down as it looks like it was a normal correction. This analysis isn’t telling you that the stock market can’t fall in 2019 or 2020 along with the balance sheet; the decline just won’t be caused by the unwind. I think the Fed will end the unwind when the next recession hits, but I don’t think there will be another round of QE when the economy weakens.
Fed Above The Neutral Rate
The next point is that the Fed is going from being below the neutral rate to above it. Powell discussed the neutral rate in his presser after the Fed hiked rates on Wednesday. The neutral rate is an opinion masquerading as a factual point. The neutral rate is an estimate of the rate where the Fed funds rate isn’t contractionary or expansionary. Since the Fed funds rate is 1.75% to 2% and the long run rate is 2.9%, the Fed is saying the Fed funds rate is still below the neutral rate.
The Fed funds rate will hit 2.9% in late 2019 if the Fed acts according to its guidance. That clearly differs from the checklist as it claims the Fed will make that shift in Q3 2018. I agree with the checklist because I have been saying the neutral rate will be hit with the 4th rate hike this year if it occurs. My difference with the checklist is that I don’t think this will cause a stock market peak. I think the peak will occur in 2019 or even in 2020. The Fed had actually been cutting rates for a few months before the market peaked in the fall of 2007.
The CPI agrees with my point as the core CPI is 2.2%. The Fed will soon be above that rate. If you’re looking at the headline, CPI which is 2.8%, the Fed is further from being contractionary. Since the economy looks strong now, we know the Fed wasn’t contractionary in 2017, but it’s not clear if the current rate is contractionary.
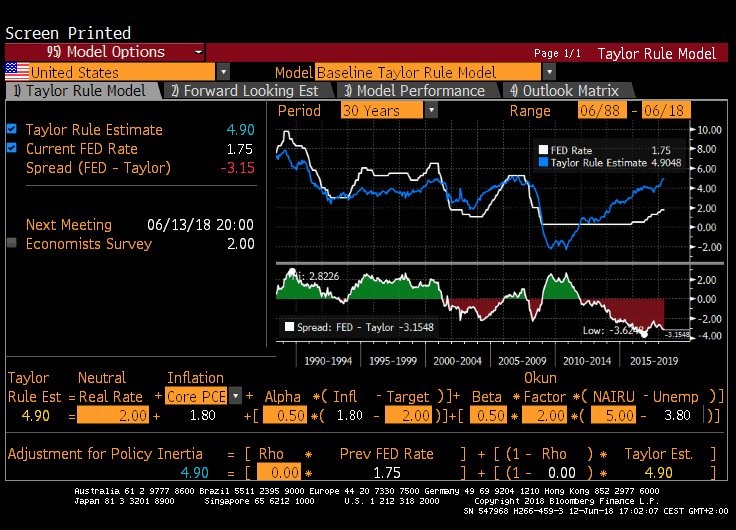
The yield curve gives us an idea of when the Fed will be contractionary. Since the difference between the 10 year and 2 year yield is now 37 basis points, the Fed is getting close to ending its rate hikes. The chart below differs from the curve. The Taylor rule claims the Fed should be at 4.9% if you assume a neutral rate of 2% and a non-accelerating inflation rate of unemployment (NAIRU) of 5%. These variables can be adjusted to get other rates. To be clear, it’s not that the Taylor Rule is saying rates should be 4.9%. Those assumptions give you that Fed funds rate.