There’s an anomaly which is playing out in Q1. Earning growth is accelerating, while the economy is decelerating. This is a point I’ve been making for a few weeks. I expect the Q1 earnings growth rate to be the peak of the year and I expect GDP growth to remain weak throughout the year. This article will focus on the myriad of reasons why GDP growth and earnings growth diverged. Whenever an unusual event occurs, in a rush to explain it, financial media outlets go overboard. They give an explanation which implies a new trend has emerged, when it’s likely a one-time event. I continue to reinforce the point that earnings growth can’t get above its long-term growth of 7% while GDP growth is below its long-term trend of 3%.
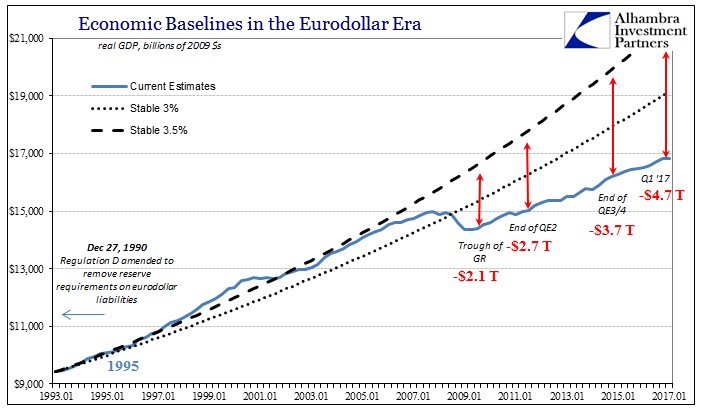
In a previous article, I showed how earnings growth usually gets above its long-term trend of 7% at the end of the cycle. Then it falls below the trend when the economy goes into a recession. Finally, it starts growing again as the cycle repeats. The chart below shows that cycle in relation to GDP growth. As you can see, GDP growth has been on that track in relation to a stable 3.5% growth rate until the 2008 financial crisis. Because the crisis was so bad and the recovery has been so weak, the economy hasn’t even reached the stable 3.0% growth rate compounded from 1993. The growth deficit as of Q1 2017 between where the economy is now and where it would be, growing at a 3.5% rate, is $4.7 trillion.
The chart shows how quantitative easing hasn’t helped make up the growth deficit. It’s clear QE has only boosted financial assets. The chart blames the removal of reserve requirements on the Eurodollar in 1990 for the economy growing less than it has historically. The reason economic growth is weak is because the labor force growth rate has slowed and productivity growth has slowed. There are many reasons for growth slowing such as regulations and the increased reliance on buybacks.
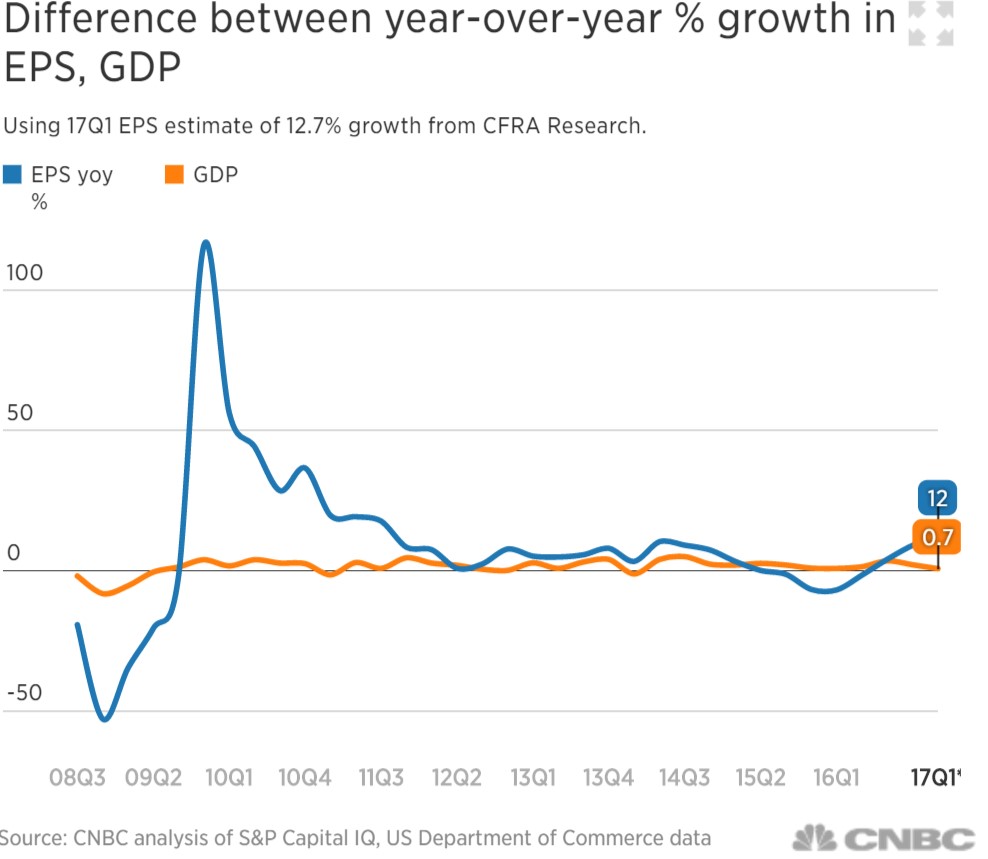
Buybacks are one of the few reasons for the chart below. As you can see, the difference between year over year earnings per share growth and GDP growth is the largest since Q3 2011 as CFRA Research says earnings growth will be 12.7% in Q1 and the preliminary Q1 GDP report showed 0.7% growth. Buybacks improve EPS without the usual necessary increases in sales or margins. When the float shrinks, EPS heads higher. Out of the 290 firms which have reported earnings as of April 28th, 171 have lower share counts year over year and 116 have higher share counts. 46 firms have a float which is 4% lower than last year and 28 firms have a float which is 4% higher. Firms issue bonds to fund buybacks which boost EPS which allows the aggregate growth rate to be temporarily faster than GDP growth.
Buybacks are one factor which boosted EPS. The most important factor is the easy year over year comparison earnings had. Q1 2016 earnings were the weakest of the mini-earnings recession as the S&P 500 earned only $86.44. Earnings still haven’t met their previous peak, so it’s not as if earnings are great and the economy is weak. Earnings are making up for lost ground. For example, Caterpillar’s Asia Pacific sales increased 12% in Q1 2017, but they fell 23% in Q1 2016. They’re still down even after the rebound in growth.
Another reason for the strength in year over year EPS growth is the rebound in oil prices. In Q1 2016 energy made up -3.41% of earnings. It subtracted from the total as firms lost money because oil fell below their breakeven cost. This quarter energy will account for 3.09% of the total S&P 500 earnings. That’s a 6.50% flip which boosted year over year results.
The final reason which shows why earnings growing above trend while GDP grows below trend is not sustainable is because the numbers aren’t directly comparable. The GDP growth is on a quarter over quarter annualized basis. It’s the number which is discussed the most in the media. It’s not necessarily the wrong number to look at, but it isn’t comparing the same period as the year over year earnings growth. The year over year GDP growth was 1.9%. This is only slightly below the 2.0% growth in Q4 2016. This is a different picture than the annualized quarter over quarter report which slows GDP growth slowing from 2.1% in Q4 to 0.7% in Q1. On an ‘apples to apples basis’, the GDP growth and EPS growth haven’t diverged as much as the chart above would indicate.
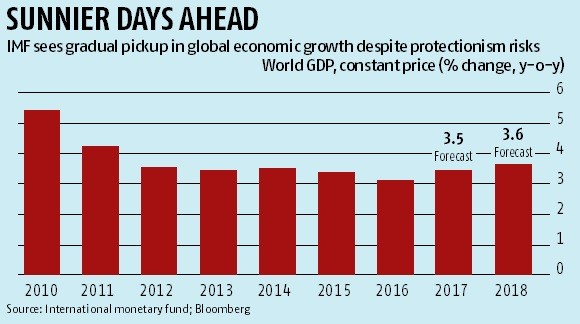
The reason bulls give for why earnings are doing well while the economy is sagging is because of international growth. S&P 500 firms with over 50% of sales coming from international markets had 19.9% revenue growth on average which is double the growth rate of more domestically oriented firms. This is in direct opposition to the Trump trade. The stock market is going up despite weak U.S. growth. The narrative was that the U.S. was supposed to drive growth. This new trend is why the Russell 2000 has underperformed the other major indices this year as small caps are more domestically oriented. In total, 46% of S&P 500 sales come from international markets. As you can see from the chart below, the IMF is forecasting global GDP growth will be 3.5% in 2017 which is a slight uptick from the 3.1% growth seen in 2016. While this uptick is helping earnings growth, it would be wrong to suggest a 0.4% acceleration in global GDP growth is the main reason earnings switched from being in a recession to growing at a double-digit rate.
Conclusion
The economy is weak and earnings are growing quickly. This is a temporary phenomenon mainly brought about by the easy comparison earnings faced. A secondary point worth noting is the comparison is flawed because earnings growth is on a year over year basis and the GDP growth rate is on an annualized quarter over quarter basis. The slight global acceleration is only partially responsible for the earnings acceleration. It’s worth noting that the IMF’s projection for 3.5% growth is not a guarantee. It relies on the U.S. growing 2.3% because of fiscal stimulus even though no stimulus has been passed and we’re now in May.