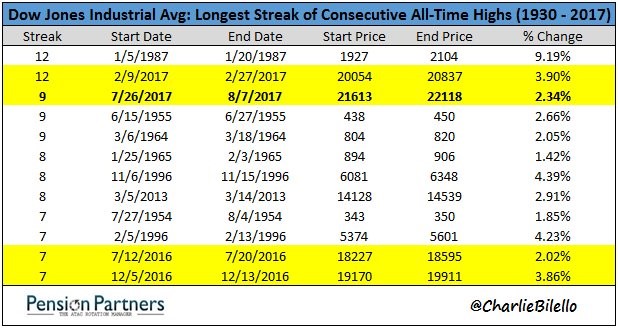
The top news event of the day on Monday was that the Dow hit its 9th straight record high as it has been up 10 straight days. The chart below shows that the 9-day streak is the 3rd longest ever. The most remarkable part is that there are 4 streaks in past two years which have made it to the top 12 going back from 1930. There are 5 which were in this bull market. It would be fitting if the record was broken this week since this is the quietest period of trading of the year as many investors have gone on vacation until September.
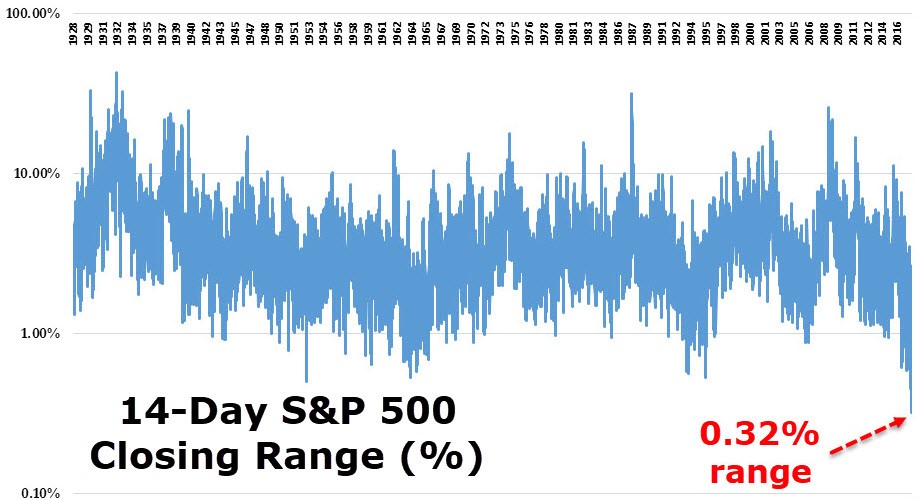
While the Dow has accelerated past the S&P 500 as it is now up 11.92% year to date, the S&P 500 has been remarkably quiet even through earnings season and the Congress’ healthcare debate. I’m not saying that the results were terrible, but you’d think the uncertainty surrounding them would cause larger trading ranges than we’ve had. As you can see in the chart below, the 0.32% trading range in the past 14 days is the tightest range in the 90 years the S&P has been around. That’s what happens when you combine seasonal quietness with the calmest market in history according to the VIX. The 10-day realized VIX is only at 2.76. My bullishness for this summer is proving to be correct. The biggest fear the market faces in the next 2 months will be the debt ceiling which traders will focus on in September. Usually foreseeable negatives don’t cause much worry, but the Congress always surprises to the upside on how dysfunctional it can be.
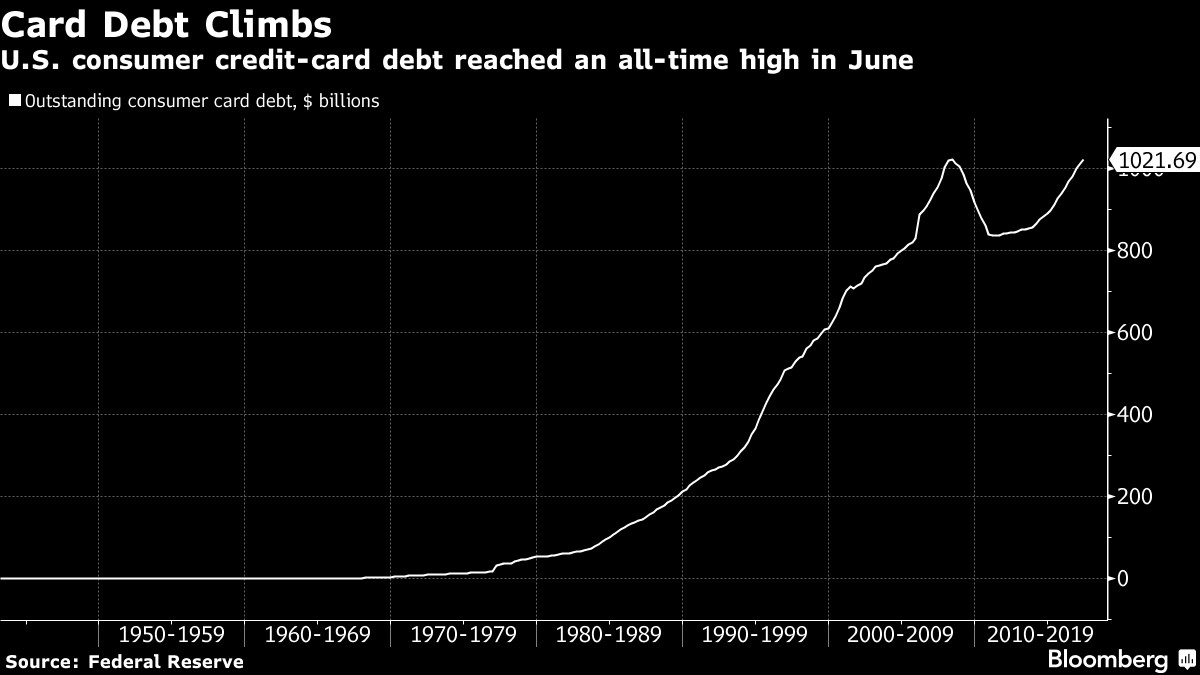
The record high for the Dow is the top story for the bulls. The top story for the bears is in the chart below. As you can see, the consumer credit card debt has reached a record high in June. It increased $4.1 billion to $1.0217 trillion. This chart makes the chart I showed in a previous article, which claims the consumer has deleveraged, look ridiculous. I don’t think this chart is as ominous as the bears claim.
The way I interpret it is that there will be a sharp deleveraging event when the consumer starts defaulting on loans when credit conditions sour and the labor market weakens. That is always the case anyway. The fact that wages and the population have risen in the past few years since 2008 makes the leverage smaller. Obviously, there has also been inflation since then. It would be shocking if credit card debt didn’t reach the previous high since it has been in an uptrend for decades. As it continues to increase in the next few quarters, the after effects of the next recession will grow.
As we have discussed many times, the most bubblish areas of consumer debt are student loans and auto loans. Their growth slowed, but both reached new record highs. Student loans are now at $1.45 trillion and auto loans are at $1.131 trillion. The next recession will likely catalyze the unwind in the auto loan bubble as sales will crater more than they do in the typical recession. The student loan market is tougher to predict because it didn’t shrink in the last recession. Kids still need to go to school during recessions. To me, it looks like the borrowing will continue until it gets so out of control that alternatives to college get more respectability. We live in the age of information where you can learn anything for free if you search hard enough. The idea that college costs so much is ludicrous. The respect that college from employers gets will come tumbling down at some point. By charging so much, colleges are digging their own graves.
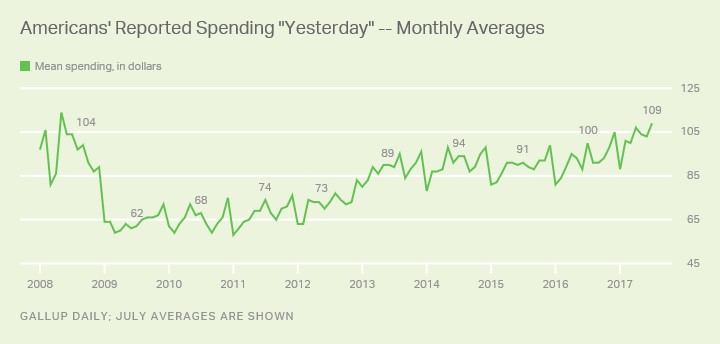
Looking at the health of the consumer, as you can see in the chart below, consumers have spent $109 yesterday which is a new high for this business cycle. This July survey shows that consumers are spending at the same level they did before the financial crisis. I find it remarkable that it took this long for spending to rebound since the unemployment rate has been relatively low for a while. The key breakdown of the data which I found the most interesting was that upper income households had a larger increase than lower income households. Those making $90,000 per year or more spent $178 which was up from $163 in June. This is a new high. Those making less than $90,000 per year spent $80 which was only up $2 from June. This didn’t reach the December 2016 high of $82.
I think the disparity comes from the rising stock market. People making $90,000 or less per year are less likely to own stocks. The stock market has accelerated higher since the election. Those who own stocks have seen their wealth rise, while those who don’t have had their wealth mostly stagnate. Even though wages have increased, the rent expenses have increased and debt levels have increased. Low income people are especially sensitive to changes in interest rates as they can’t deal with rising debt payments as easily. Luckily for them, the Fed is only expected to raise rates one time in 2018. Right now, the economy is not too hot and not too cold. If growth accelerates, it could cause selling in bonds, increasing interest rates, spurring the end of the business cycle as low-income borrowers start defaulting more on their loans.
Conclusion
The U.S. consumer drives GDP growth. With consumer spending reaching the previous cycle high, it’s not surprising to see earnings and the stock market doing well. The top technology firms (Facebook and Alphabet) need the consumer to do well because they are advertising firms. The consumer is leveraged with student loans and auto loans, but they can pay them off if the labor market stays strong. We are in the sweet spot with low rates and low inflation along with a decent economy which appears to be gaining strength after the late 2015-early 2016 slowdown.