Going into the year I predicted the Trump trade would unwind. This means I expected the dollar rally to end, interest rates on government bonds to fall, inflation to fall, and cyclical stocks to fall. I still hold this view and it’s too early to make a final judgement on this perspective. However, there’s been an interesting turn of events in the past couple weeks. The correlation between these assets has gone away. Out of the dollar, treasury, and cyclical trade, I have been correct on one. The dollar has fallen, but treasury yields and cyclical stocks have rallied.
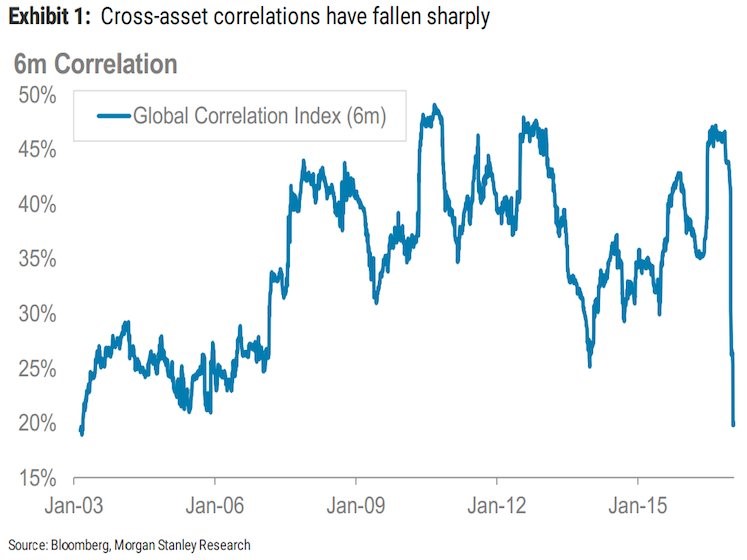
It’s been interesting because in the past few weeks we’ve seen the dollar and gold fall. You’d think that is impossible because gold and the dollar counter each other. However, gold has been keying off stocks. When volatility fell, gold would fall because it’s viewed as a safety trade. The chart below shows the decline in cross asset correlation which I am referring to. Clearly, I didn’t expect the huge gap down which we’ve seen. Some are arguing that a decline in cross asset correlation is a late-cycle signal. I don’t know if that’s true because the correlation fell a couple years ago, as you can see in the chart below, yet nothing meaningful occurred. I think a decline in correlations signals a paradigm shift. This shift can be the result of a changing monetary policy, changing fiscal policy, or changing of the stage of the business cycle. In this case the fiscal policy is changing so assets are reacting to events differently.
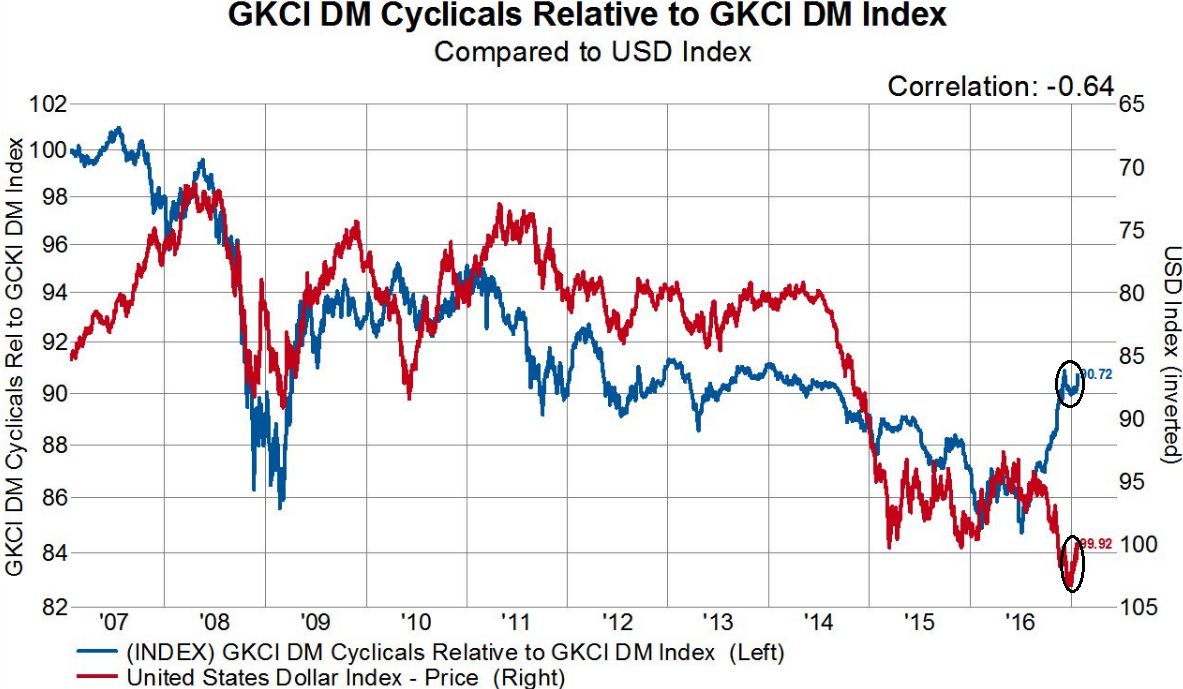
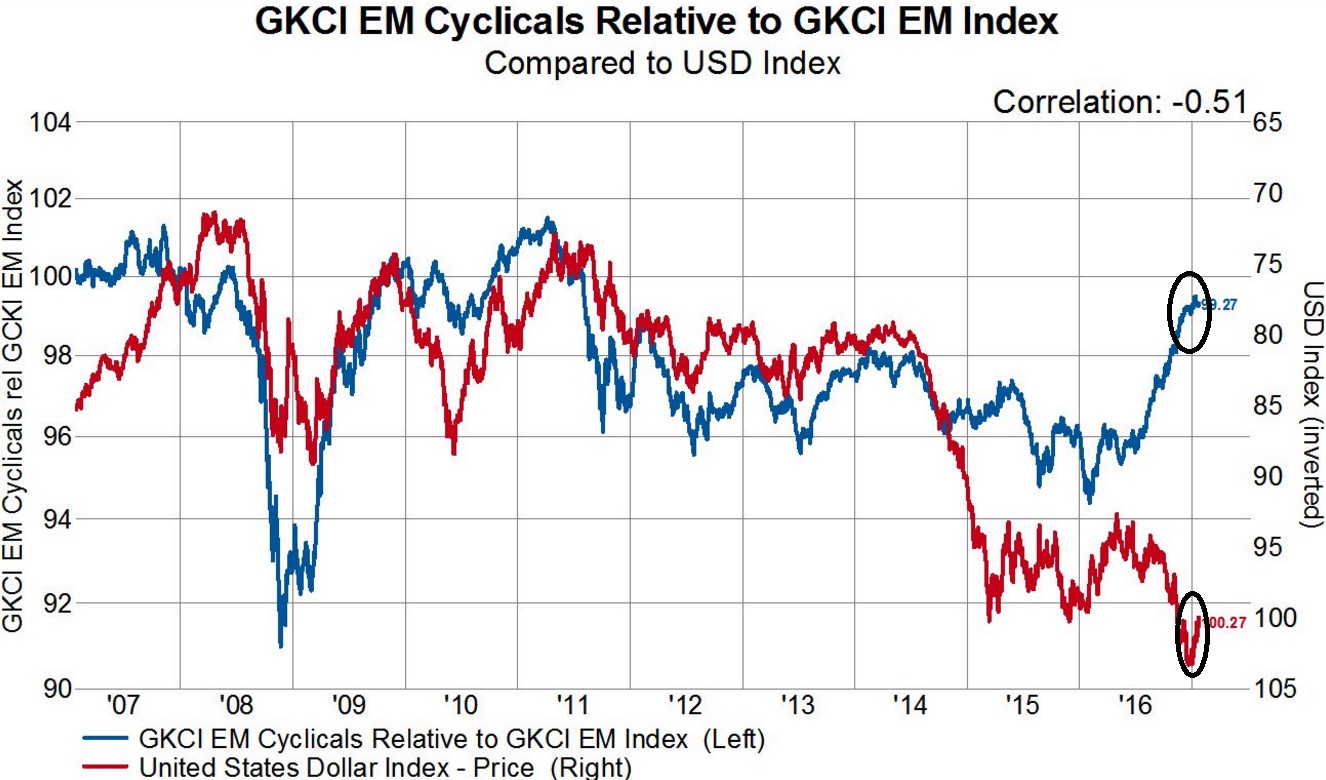
The chart below shows the change in the market I’ve been referring to. In this case the correlation has re-coupled, but it represents a change from the past few months of trading. The developed market cyclicals are rising and the dollar is falling. There is also a chart which shows the relationship between emerging markets cyclicals and the dollar which shows the same change in relationship. Prior to this recent re-coupling there had been a breakdown in the correlation. This was caused by traders believing that Trump’s policies would cause a spur in growth which would be centered on building America up. The America First mantra with infrastructure spending and tariffs was thought to help America at the expense of other nations so its currency was rallying in relation to them. Another point is that because inflation was increasing, the Fed was expected to be hawkish. A hawkish Fed brings about a strong dollar.
The dollar has begun to selloff because some investors are having second thoughts about the amount the Fed will raise rates. Also, Trump has explicitly said he favors a weak currency to help America have better exports. The Trump trade was going against the very words spoken by Trump himself!
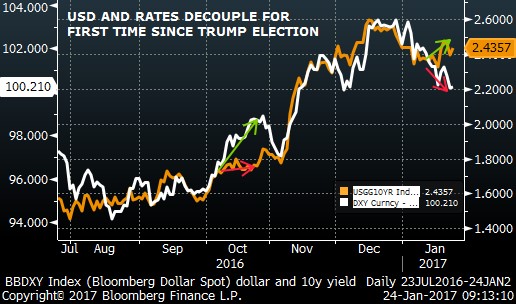
The chart below shows the de-coupling between the dollar and treasury yields. The 10-year treasury is now at 2.50, so it has gone further in the past 2 days. One possibility is that the market thinks Trump will borrow a lot of money through infrastructure spending and tax cuts. This borrowing will increase interest rates because of the new supply of treasuries. The dollar would weaken in this scenario because of the high deficits being run up.
As you have read, there are many possible explanations for this shift in the Trump trade, but those are arguments that have always existed. We always knew that big deficits could increase interest rates and pop the dollar bubble. The question is what the catalyst was for this phase change. Bank of America did a report where it claims the catalyst for this change is the bifurcation between breakeven inflation and real inflation. Breakeven inflation is a market based measure of inflation. It measures the difference between nominal bond yields and inflation protected bond yields such as TIPS (treasury inflation protected securities). I think Bank of America is counting CPI as the real rate of inflation, but I’m not 100% sure.
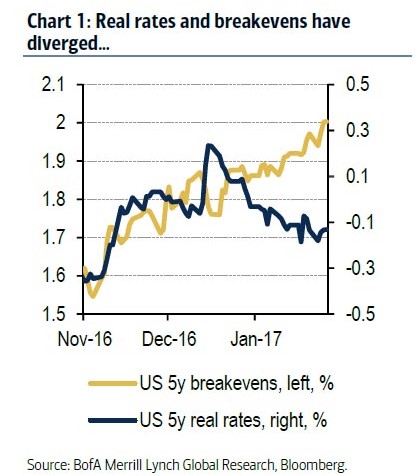
If you assume the bifurcation between these rates of inflation is responsible for this change in the Trump trade, the big question is which rate is telling the truth about inflation. Eventually the two will converge. Will real rates rise or will breakeven rates fall? Obviously, I can’t know the answer to this question for sure, but I’ll give you my thoughts. Usually I would trust the market to decide the proper rate because I believe the actions of informed speculators give you a great amount of information. It’s why I would trust the betting odds for an election more than the polls. However, as we saw with Brexit and Trump winning, the betting odds can be wrong. As we see with the current valuation of the market, it also can make big mistakes. Traders like to say the market is always right, but that’s because the market will have the final say over whether you make or lose money. However, it is objectively true that when the Nasdaq bubble was at its peak, the market was wrong about valuing tech stocks so high when they had no earnings in some cases. The correct trading strategy is to recognize the market can stay irrational for longer than you can stay solvent.
Therefore, I trust the real rate of inflation more than the breakeven rate because I think the market is overly excited about the future inflation expectations, GDP growth, and earnings growth. Going through the scenarios, if the breakeven rate falls, cyclical stocks and treasury yields will fall, thus the Trump trade will be completely reversed. If the real rate of inflation rises, then the dollar will rise, thus the Trump trade will keep going fully.
As a caveat to this article, correlations among asset classes can stay low for years like they were in the early 2000s. Also, there is no specific time frame when the breakeven and real rate of inflation have to converge. Finally, the over-valuation of stocks can continue for a long time.