Spreads Tighten But Retail Is Weak
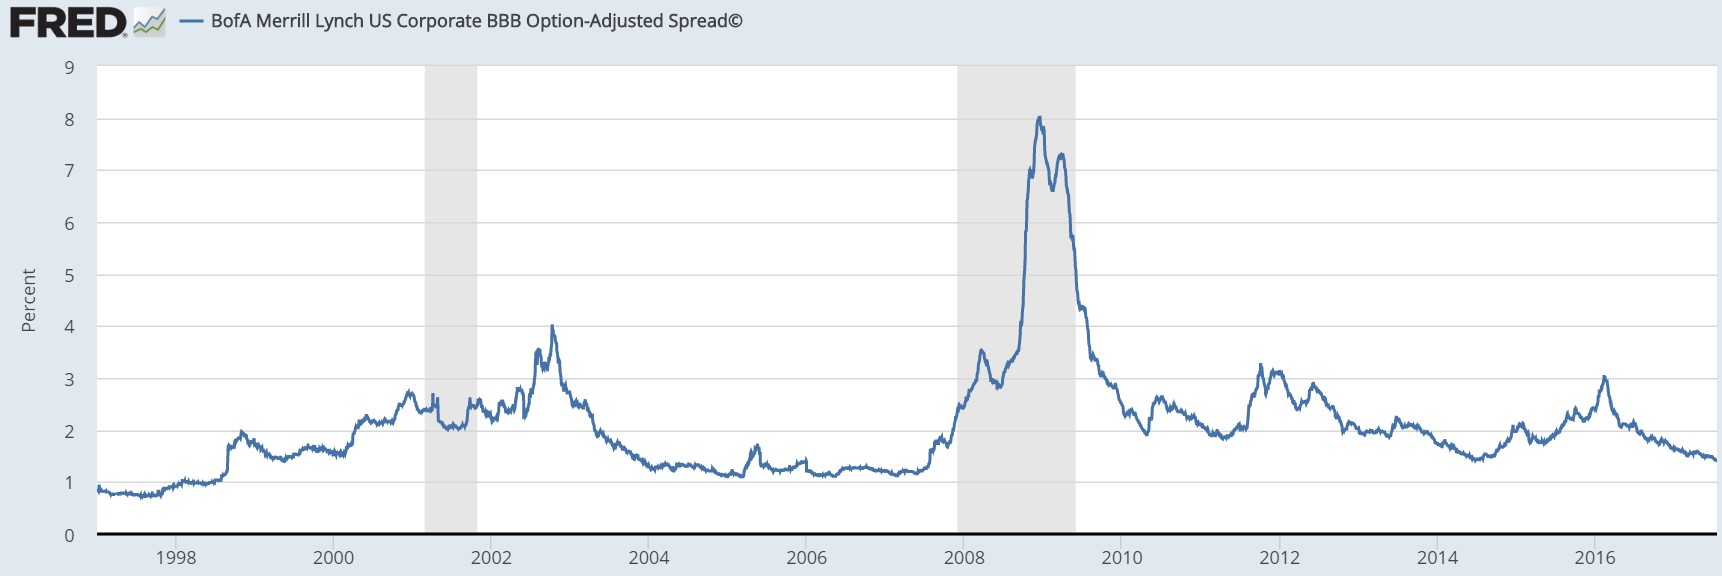
Many investors are focused on the record highs in the S&P 500 and the Nasdaq and the VIX staying below 10 for another day, but I think the biggest story of Wednesday’s trading session is the tightening of bond spreads. As you can see from the chart below, the options adjusted spread for U.S. corporate BBB bonds reached a new cycle low. The spread fell to 1.41% which is below the tightest 2014 spread. This isn’t surprising because it has been flirting with this level for a few weeks. I think it’s justified based on the overall earnings situation despite the weakness in retail and energy. I have seen bears like Jonathan Tepper use this tight spread to make negative conclusions (he also mistakenly said it was the all-time low which isn’t true as you can see). This is a faulty conclusion if you look at the whole chart as the spread was tighter for many years without consequences in the 1990s and the 2000s.
Because this is a new cycle low which is the lowest in 10 years, it makes it look like this is a top signal. The reason it took this long to get to this level is because of the 2015-2016 earnings recession. It would be ridiculous to suggest that the great earnings reports in the past few quarters are somehow a negative. It might be years before the spread begins to widen again. This chart won’t tell you when a turn is coming as it reflects the changes in earnings. The way to project earnings changes is to see what the catalysts for sales growth are showing. The key point is that a wide spread doesn’t mean you should buy stocks and a tight spread doesn’t mean you should sell them. While it’s not a market timing device, it gives you a good idea whether investors are in risk on or risk off mode. It shows how stability in the junk bond market was much more common before the financial crisis, so you shouldn’t be worried about a calm environment leading to the next crisis.
As I mentioned, the two sectors which are making debt spreads widen are energy and retail. The chart below shows the retail bankruptcy recovery rates compared to all sectors’ unsecured debt recovery rates. As you can see, the percentage of retail firms with less than a 10% recovery rate is over double that of all sectors.
These recovery rates remind of the weakness seen in fracking firms in 2015-2016. The fundamentals are similar in that there isn’t collateral for the lenders to take from the business. With energy prices falling, frackers had less real assets to back them up. To be clear, even though I mentioned oil being a weak sector now, it’s not close to the strife it has had in the past few years which is what I’m referring to. With retail, during default firms have a higher than usual propensity to liquidate instead of re-organize. This is probably because management and lenders feel that the strategy was tried and failed. There won’t be a new product which could rocket the business back to profitability because retailers don’t create products, they just sell them. Even if they have generic products, that isn’t a category where there’s innovation which can drive a turnaround. Secondly, retailers are asset-light which means creditors need profits to be re-payed. Once the cash flow runs dry, there’s no assets left over to give to lenders like with E&P firms.

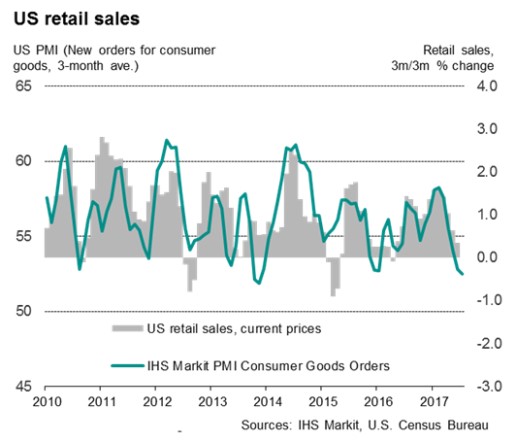
Although Netflix and Amazon are doing well, most retailers are getting hurt by soft consumer spending which is being weakened by the expensive cost of housing. As I have discussed previously, rent expense as a percent of GDP is higher than ever. The result can be seen in the Markit PMI Consumer Goods Orders index which has gone negative. It doesn’t have a perfect correlation with retail sales, but you can see the grey bars, which show retail sales, have also been slumping.
Inflation
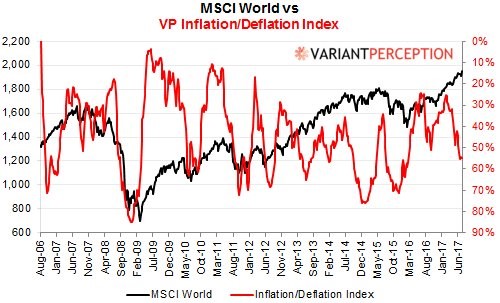
I have shown a variant to this chart before. Usually growth does well when inflation increases. This time, growth is doing well without inflation. This makes Fed and ECB policy look ridiculous because they have been trying to get to 2% inflation for so long. It’s like someone who saves up money for 10 years to buy their dream car and when they buy it, they realize they got a lemon. Much like how a new car owner wouldn’t want to admit he got a lemon, the monetary policy experts don’t want to admit inflation doesn’t equal growth. This chart is a double whammy because it shows the MSCI index which is what the central banks have been boosting. It shows how propping up the market doesn’t cause inflation.
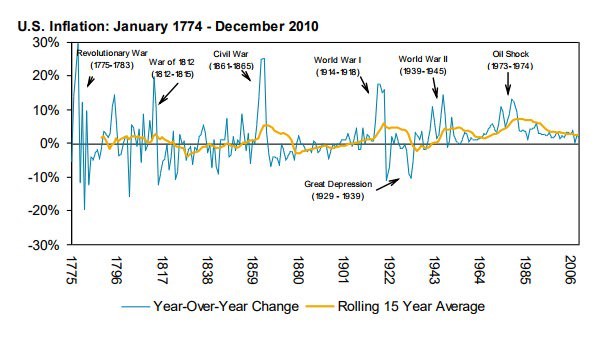
An interesting point which I hadn’t considered is part of the reason we have such low inflation is because we live in historically peaceful times in terms of the number of global deaths in wars compared to history which has been littered with violence. The chart below shows the historical inflation rate. As you can see, many of the increases in inflation in the past 200 years have been caused by war. Peace leads to lower inflation which, in turn, leads to higher stock multiples. Peace allows companies to expand abroad easily which boosts profits.
Conclusion
The optimism in the economy has led investors to tighten spreads more than ever before in this cycle. Don’t be worried by this as there were periods of a few years in the 2000s and 1990s where spreads were tighter. The major weak spot is retail which is seeing brick and mortar stores face bankruptcies which have low recovery rates for bondholders.
One reason for the long-term inflation rate being subdued is because of the low number of deaths from wars. It’s amazing how the Fed wants higher inflation because throughout history inflation being too high has been more of a problem.