Jobless Claims Fall
It was a mistake to assume that in the 2 weeks California is pausing its initial claims transactions that their numbers would completely drop out of the total. That wasn’t what happened. They just kept California’s numbers the same, and included whatever initial claims CA had in the prior report in this one.
Say, California, had 100,000 claims. They are just extending that total in this report and the next one. That might overstate claims because they are falling nationally. On the other hand, we wonder what will happen 2 weeks from now when the state starts accepting claims again. Most likely they will increase because of the backlog.
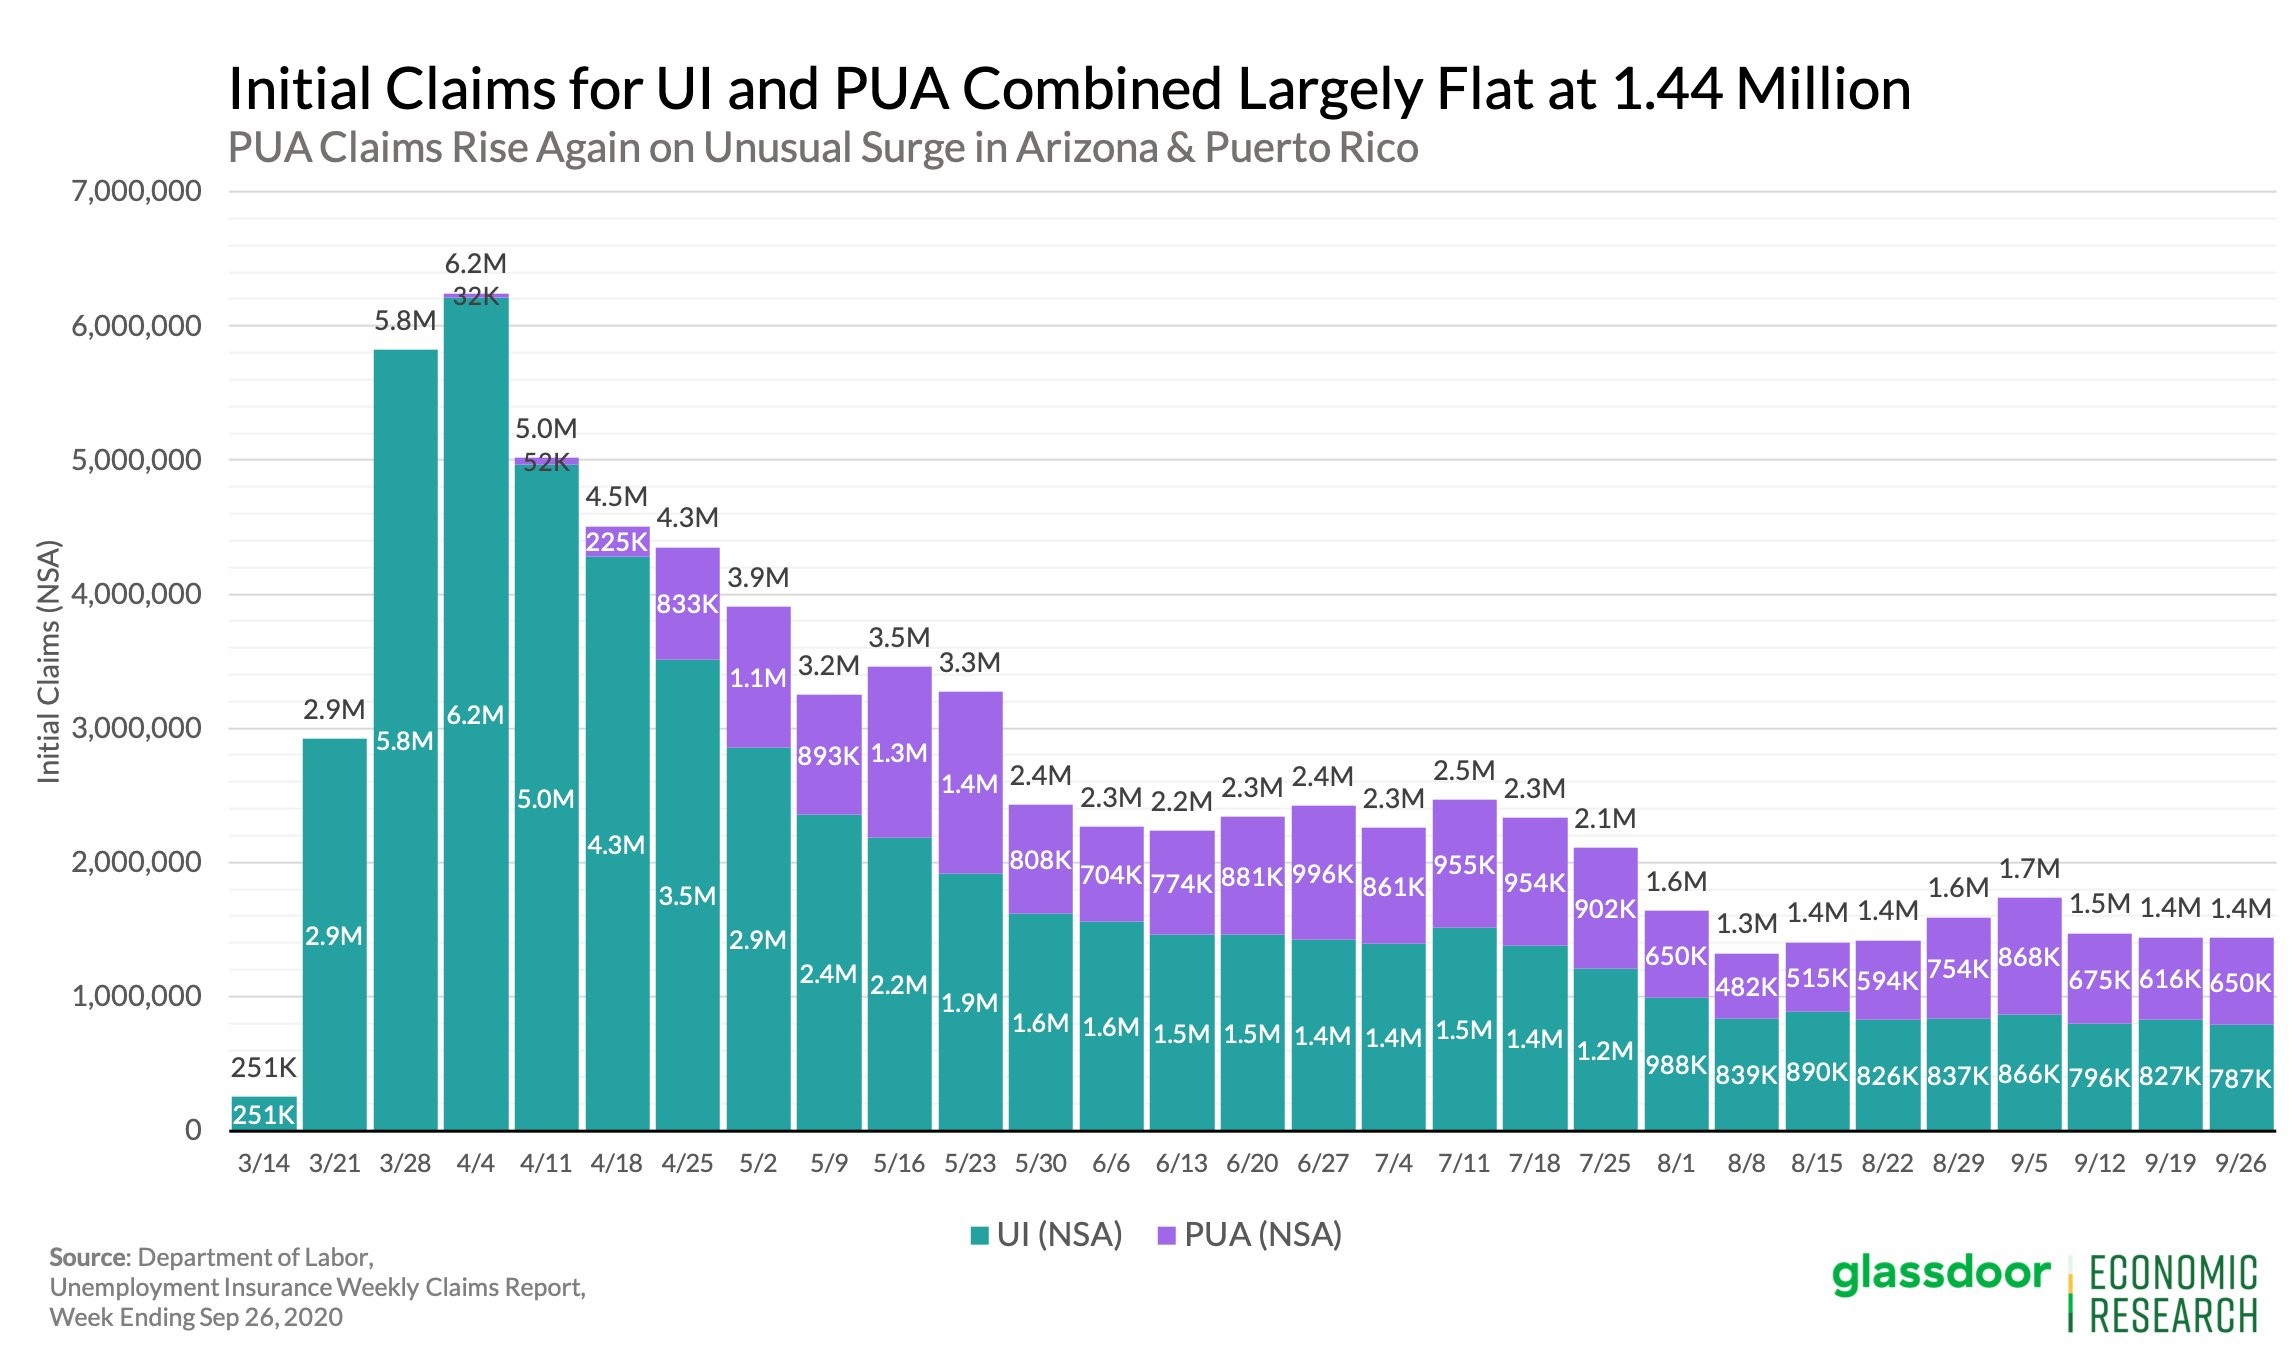
With that in mind, the initial claims update in the week of September 26th was actually good. Seasonally adjusted initial claims fell from 873,000 to 837,000 which was below estimates for 850,000 (obviously a good thing). Furthermore, as you can see from the chart below, NSA initial claims fell from 827,000 to 787,000. That is a new cycle low.
Since August, it appears we have reached a new part of the labor market recovery in which initial claims fall at a lower pace. That makes sense because we are only a little more than double the normal rate in an expansion. First week the economy wasn’t in a recession last cycle, initial claims were 581,000. Therefore, initial claims are below the previous recession’s peak, but not yet at the start of the last expansion. We’re getting close though.

As the chart above shows, initial PUAs rose from 616,000 to 650,000 which caused the total of PUAs and initial claims to be stagnant. A main way for PUAs to fall is for them to fall in California and Arizona where the data is probably inaccurate.
Since California had no change this week because the data wasn’t updated, it’s no surprise total new PUAs didn’t fall. It's likely they will fall sharply when California starts updating its data again in 2 weeks because there will be less fraud. At that point, PUAs won’t affect the total as much. And they won’t be close to regular initial claims for the week.
Adding to that issue, Arizona had a large increase in PUAs. They rose 15,468 to 220,156 which means the state was responsible for almost half of the national increase. Furthermore, the state represents 34% of total national PUAs even though it only has 2.2% of the population. That’s why we can’t take the PUA numbers at face value.
Continued Claims Also Fall
Continued claims fell sharply in the week of September 19th as we get into the period where normal claims that last 26 weeks expire. Luckily, we have pandemic programs and extended benefits to help people as they search for new jobs. That being said, the labor market is still improving. Obviously, when you have improved consumer confidence and 749,000 private sector jobs added, something is going right.
Specifically, continued claims fell from 12.747 million to 11.767 million. That 980,000 decline is the largest since the 3rd week of August. It’s a pretty large drop when you consider how far claims are off their peak. Claims are still above the high in the past cycle which was 6.6 million.
Claims will likely fall below that peak in November. Obviously, that doesn’t mean the labor market is fully healed. It won’t be healed until COVID-19 goes away because the industries most affected won’t come back until then.
A Different Kind Of Recession
Even if the unemployment rate falls below 7.5%, most won’t say the economy is back to normal until independent restaurants come back. Unfortunately, an audit showed half of NYC bars and restaurants could close permanently.
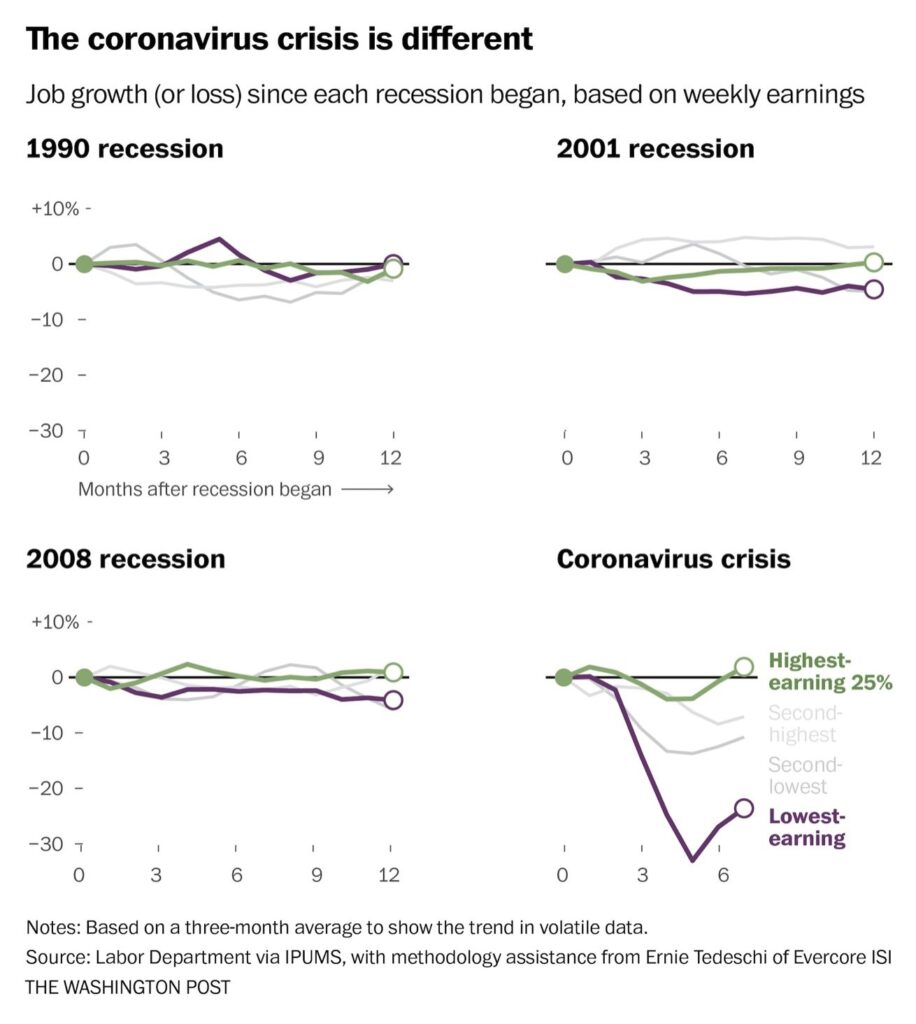
As you can see from the charts above, this has been a different kind of recession. In the 1990 recession, the lowest earning jobs barely lost any workers and had higher growth than the highest paying jobs. In the following 2 recessions, the lowest paying jobs underperformed modestly.
This recession was a disaster because leisure and hospitality was hit the hardest and these jobs pay people the least. It’s painfully ironic how income inequality was discussed as a national disaster before this recession and it has now gotten much worse.
Good news is the stimulus checks and unemployment benefits stifled the blow temporarily. A problem is the checks are gone and jobless benefits are on their last leg. That’s why the stimulus is needed for the bottom quartile of Americans.
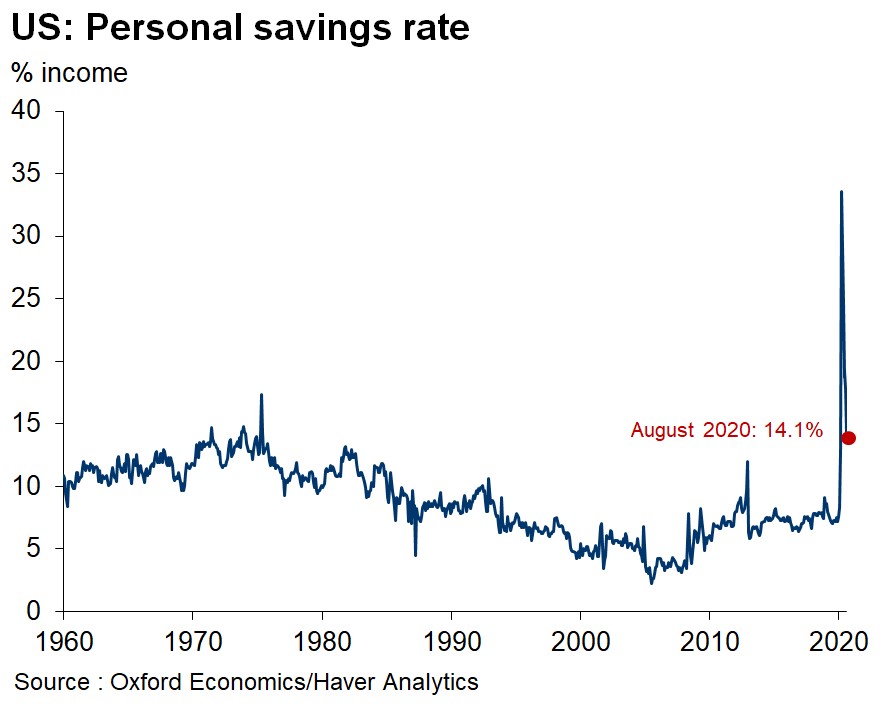
As you can see from the chart below, the personal savings rate fell to 14.1% from 17.7% in August. It’s still about double the normal level, but that was a rapid decline. A decline in the savings rate is probably a combination of poor and middle class people not having enough money to save and upper middle class/upper class people feeling more comfortable with spending. There needs to be additional help to prevent poor people from falling into the permanent underclass of society.
August PCE Report
In the August PCE report, personal income fell 2.7% which was down from 0.5% growth and missed estimates by 2 tenths. As you can see from the chart below, the negative swing in personal income was the result of the decline in unemployment benefits. With states paying out the $300 per week from the federal government, this might swing positively next month. Still it’s important to not understate the 3.2% decline in disposable personal income.
Good news is compensation growth was positive again. Compensation growth was the weakest in 4 months, but that’s to be expected given the tough comps. It’s notable that in the short term, growth in compensation can’t make up for weakness in transfer payments. Compensation is more sustainable though.

Personal spending growth was 1% which beat estimates for 0.8% and fell from 1.5%. Spending on services remains an issue, while spending on goods was still high. Specifically, services spending is 8% off its pre-recession level and spending on goods is 6% above its pre-recession level.
If COVID-19 goes away and we see a mean reversion where goods do worse and services do better, it will help the overall number as services are more important. On that point, overall spending is 4% off its pre-recession high.