Surprisingly Solid ISM PMI Likely Coming
Based on the solid regional Fed manufacturing reports, the ISM manufacturing PMI will probably show modest sequential improvement. I expect the PMI to be from 51 to 53. The July reading was 51.2. August ISM PMI comes out on Tuesday. The chart below shows the improvement in the average of the regional indexes. Sequential improvement was driven by the Dallas and Richmond Fed reports. Richmond Fed index was 1 which was a big increase from the -12 reading in July. Consensus was -4 and the high end of the consensus was -1, meaning both were beaten.
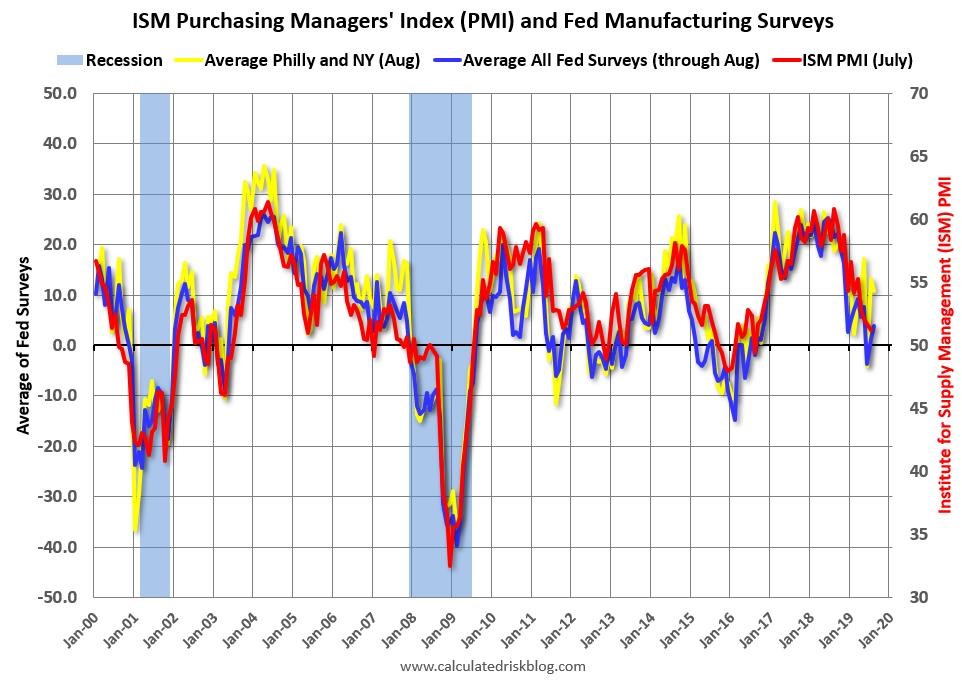
It’s surprising that the ISM PMI might show modest improvement because the manufacturing sector contracted in July and the tariffs seemingly have made the situation worse. Most firms in these regional Fed reports have mentioned tariffs hurting their businesses.
Getting to the details of the Richmond Fed report, the shipments index was up from -13 to 5 and the volume of new orders index was up from -18 to 2. The local business conditions index was up from -18 to -3 and the capex index was up from 7 to 9. These are sizable improvements which you usually don’t see in manufacturing recessions. The expectations categories didn’t show the same improvements as the components of the current index similar to the Dallas Fed report. For example, the shipments index fell from 32 to 18 and the new orders index fell 5 points to 31. Local business conditions fell from 25 to 12 and capex fell from 19 to 14.
Deciphering The Coming Manufacturing Recession
In looking at the Richmond Fed report, I will ignore the decline in the 3 month moving average because that weakness is driven by the July decline. However, I won’t ignore the weakness in expectations. Even in the improved Richmond and Dallas Fed reports, expectations cratered. There is a good chance the manufacturing sector has a solid contraction in the second half of 2019. That’s not to say an overall recession is coming soon or that manufacturing will contract as deeply as it did in the 2015-2016 slowdown.
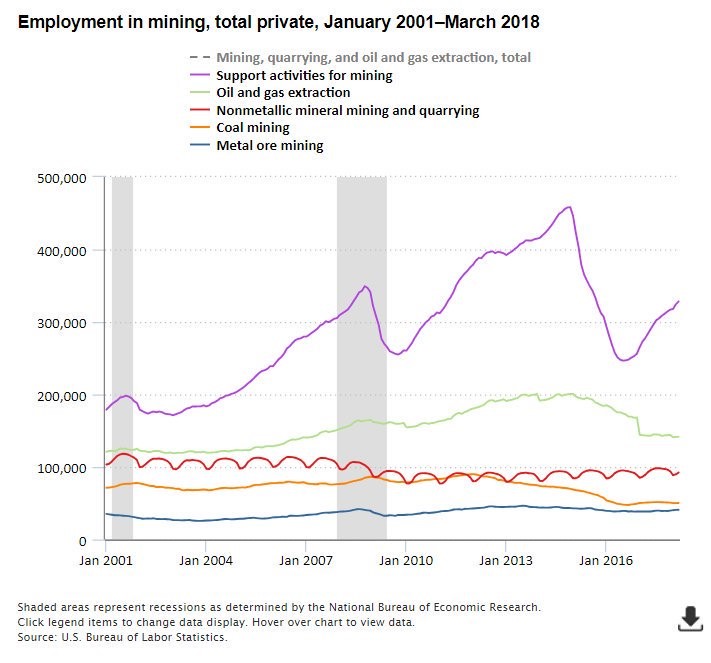
I expect industrial production weakness to be broader based and mining to decline less. That’s because the global slowdown and tariffs are hurting many industries, but oil didn’t collapse recently like it did in late 2014 and 2015. The fracking industry didn’t hire as many workers this mini cycle as it did at the peak in 2014 as you can see in the chart below. Similar to the housing market, there’s less room to fall.
Oil prices actually rose 1.75% to $55.86 on Wednesday as US oil inventories fell sharply. Specifically, oil inventories fell 10 million barrels instead of 2.1 million barrels. The oil market isn’t following long bond yields lower. While oil prices aren’t historically high, oil started the year at $45.33. Oil’s major decline was from October 2018 to December 2018 when it fell from about $75 to about $43. If oil doesn’t fall much in the next 2.5 months, it will be up year over year. The CRB Bloomberg commodities ETF has done a little worse this year. It is up 0.82% year to date and down 10.7% in the past 12 months.
Q4 2018 was terrible for commodities. It’s interesting because in Q4 2018, stocks and commodities signaled a recession was coming while bond yields soared. Now stocks and commodities aren’t doing poorly, but the 30 year yield is declining as if severe weakness in nominal GDP growth is coming.
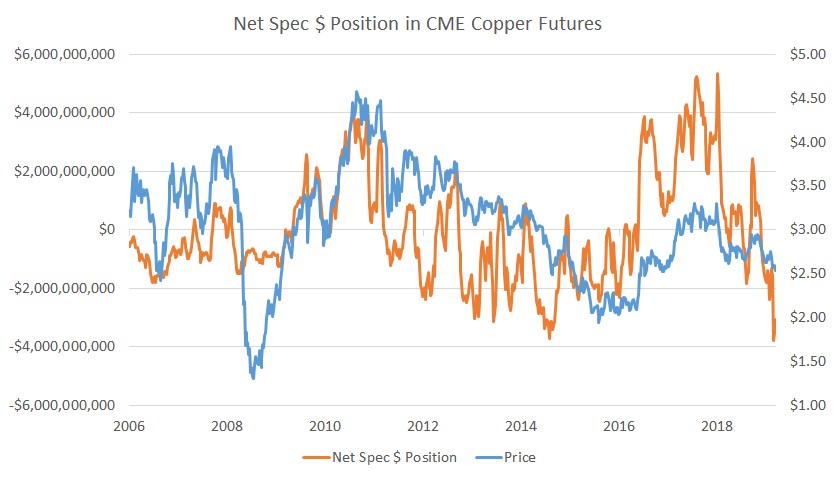
As you can see from the chart below, copper prices have cratered in the past few months. From April to August, prices fell from about $3 to about $2.5. As you can see, the net dollar speculative position in copper is almost the most short ever. Either there will a sharp slowdown soon or copper prices will rise in the next year. Copper prices bottomed at about $2 in the 2015-2016 slowdown.
Housing Price Growth Falls Further
It’s not a surprise housing price growth continued to fall in the latest readings because the latest data is from June. If this data was from August, I’d expect price growth to be steady. That being said, I am surprised by how much the Case Shiller national price index’s yearly growth rate fell. It went from 3.4% to just 3.1%. That’s the weakest growth since September 2012. The yearly growth comps are going to continue to get easier in the next few months and affordability is already up. That should prevent growth from falling much further in the next few months. From May to June 2018, price growth fell from 6.3% to 6.2%. By August, yearly growth fell to 5.7%.
I continue to think that yearly growth won’t fall negative unless the unemployment rate rises significantly or interest rates spike. Affordability is up because interest rates have fallen significantly. Average weekly wage growth in June was just barely below home price growth as it was 2.8%. Home price growth will likely be above average weekly wage growth again in July since weekly wage growth fell to 2.6%.
On a monthly basis, the 20 city seasonally adjusted index was flat which fell from 0.1% growth and missed estimates for 0.2%. On a non-seasonally adjusted basis, growth fell from 0.6% to 0.3%. On a yearly basis, growth fell from 2.4% to 2.2% which missed estimates for 2.3%. As you can see, big cities had lower growth than national housing. Similarly, the FHFA index’s growth rate fell. National monthly growth was 0.2% in June which matched May’s reading and missed estimates for 0.3% growth. On a yearly basis, growth fell from 5.1% to 4.8% which was the weakest growth rate in 5 years.
Weak MBA Index
The MBA applications index has been strong this year, but it had a very weak reading in the week of August 23rd. The composite index fell 6.2% weekly after falling 0.9%. The purchase index fell 4% after falling 4%; yearly growth was only 2%. There have been 5 weekly readings with negative yearly growth in 2019. The refinance index fell 8% weekly after rising 0.4%. On August 22nd, the average 30 year mortgage rate was 3.55% which was the lowest rate since November 3rd, 2016.