Credit Card Debt Is Over $1 Trillion
The consumer is at a crossroad. If wage growth accelerates in 2018, everything will be fine, but if the economy turns south, the consumer will be in a world of hurt. Some readers might say that if the economy goes south, the consumer will always be in pain. While that’s true, the amount of pain depends on the savings rate and the debt incurred. If a recession had occurred in 2012, there wouldn’t be as much pain as a recession that happens in 2018 because there’s more debt. It’s the same situation when we looked at valuations. Sure, when the momentum in the stock market falters, it’s bad. However, if you start at a more expensive point, then there’s further to fall. If margins start at a record high, there’s a long way to fall to get to the long term average. Momentum matters when it comes to timing the market. Factors such as consumer debt, profit margins and valuations effect how far the fall is.
To give a personal example, if someone loses their job with $10,000 in credit card debt, it’s a much worse situation then someone who loses their job when they have no debt. Both are bad, but the situation with the debt is dire. Momentum covers for everything until the tide goes out and we see who was living above their means. Recessions are equalizers in the sense that they reward people and businesses who are conservative. If the momentum were to continue forever, the best position would always be to be aggressive.
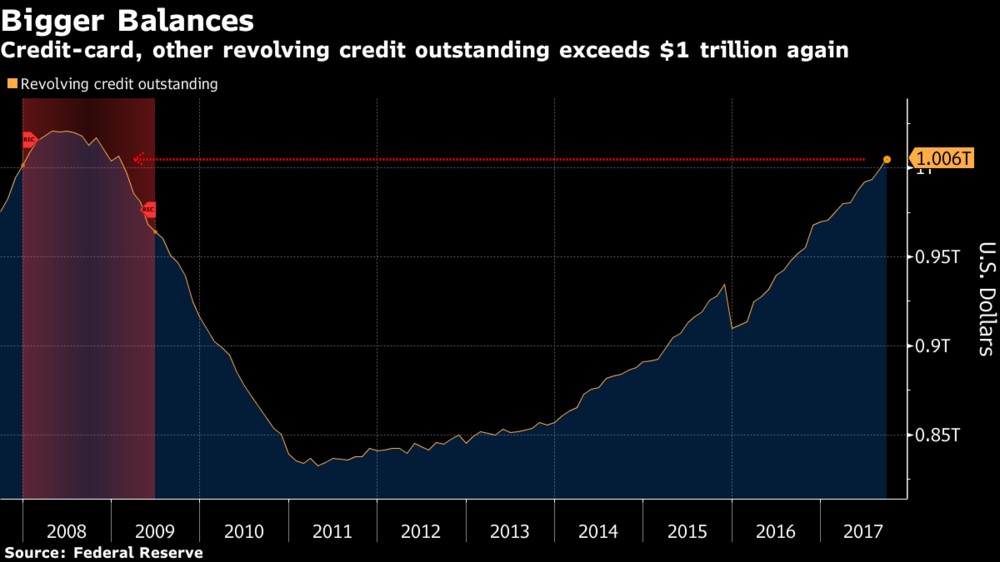
The chart below shows how the revolving credit outstanding for consumers has reached $1 trillion for the first time since the financial crisis. The last recession was a tough deleveraging. The big advantage the consumer has this time around is far fewer took out mortgages they couldn’t afford. The next recession probably won’t be as bad as the last one because of this. The one caveat to that is if interest rates rise significantly, the consumer could be hit hard. Getting back to the September consumer credit report, the total credit rose $20.8 billion which is a 6.6% annualized growth rate. Non-revolving debt outstanding went up by $14.4 billion. Revolving credit increased $6.4 billion which is the biggest gain in 4 months.
The annualized Q3 growth in credit was 5.5% which is the fastest growth this year. The non-revolving debt increased partially because of the auto loans taken out to buy the cars which replaced the ones destroyed from the hurricanes. Loans for motor vehicles increased by $19.3 billion in Q3. This is a painful reminder that there’s a benefit in GDP growth from hurricanes, but people’s net worth takes a big hit. Lending by the Federal government was up by $35.2 billion. That lending is for student loans mostly. That shows how large the student loan debt bomb is.
If you think the government can just wipe away student loans, think again. The government is running big deficits. If there’s no room for tax cuts, there’s no room in the budget for complete student loan forgiveness. There won’t be one event that causes student loans to be proven to be a mistake unlike housing in which people realized the mistake when their mortgage was underwater. Time will tell how this unwinds. I find it remarkable how easy it is to find information online for free, yet students pay thousands of dollars for textbooks. They pay tens of thousands for tuition when lectures are available for free on YouTube.
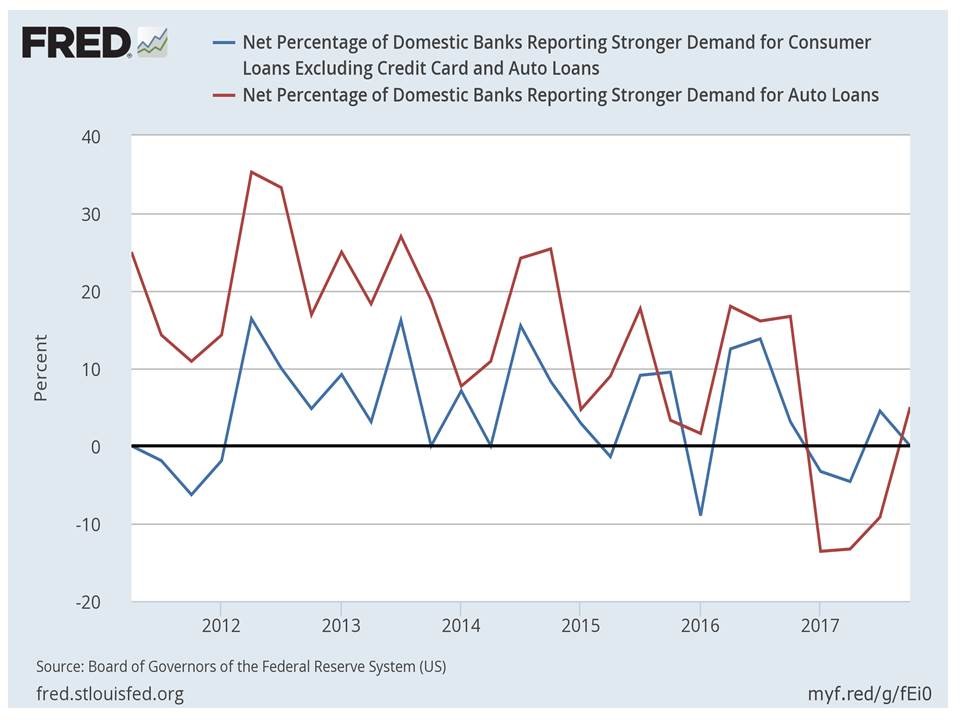
It’s interesting to compare those stats on consumer credit with the senior loan officer survey which shows whether banks are tightening or loosening their standards and where the demand is for the loans. The chart below shows the demand for loans excluding credit cards and auto loans and the demand for auto loans. The auto market was in a world of hurt before the hurricanes as the lending standards were tightening and the demand was declining. Now just the standards are tightening as the demand has increased because of all the cars that needed to be replaced. The lending standards started tightening in early 2016, while the demand started declining in late 2016. The lending standards appear to be trending towards tightening for the debt excluding credit cards and auto loans. On the other hand, demand doesn’t seem to be in any sort of trend. This chart goes against the stats on the amount of debt the consumer is taking out and how excited sentiment reports show they are.
JOLTS Gives Us A Mixed Picture Of The Labor Market
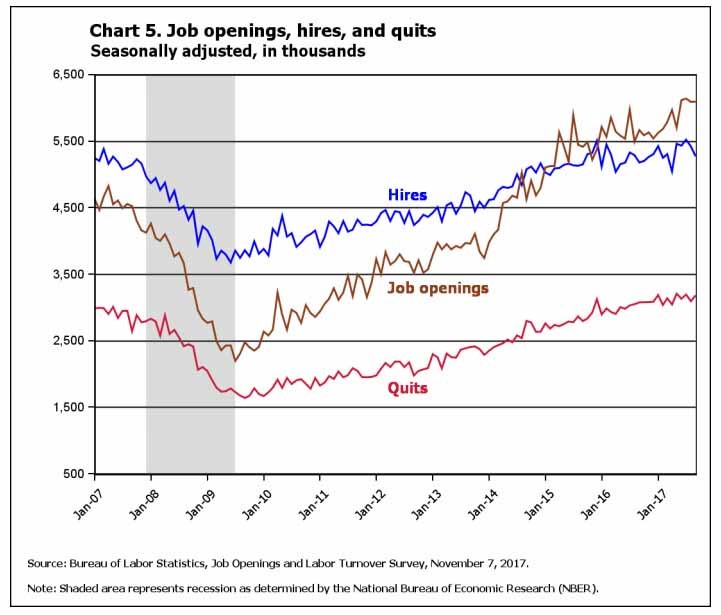
The JOLTS report is a delayed picture of the labor market. It shows the September hires, job openings, and quits which you can see in the chart below. The total number of job openings was 6.093 million which was a small increase of 3,000 jobs. As you can see, the job openings rate of 4% has led to a higher number of job openings than last cycle. The number of quits and hires are both hovering near the level seen before the last recession. The hiring fell by 147,000 which was the lowest report since April. This lowered the hiring rate to 3.6%. Hiring was only up 1.8% year over year. The fact that hires fell more than job openings supports the notion that there’s a skills gap. On the positive side, the September quits increased from 3.093 million to 3.182 million. There were 1.7 million layoffs in September which was the same as August. The layoffs and discharges rate was 1.2%.
Conclusion
The consumer is at the same debt level as it was during the last recession. That’s not a place where we want to be as an increase in interest rates and a softening of the jobs market could cause massive pain for the consumer. What’s painful for the consumer is painful for the overall economy as consumer spending drives two thirds of GDP growth. The near term looks fine as consumers are ready to spend more money than ever on Christmas gifts. Looking at the next 2-3 years, it looks like another deleveraging event is likely as the savings rate is low and the debt is high.