Consumer Confidence - Expectations Improve
Consumer Confidence - the consumer surveys are quite volatile and divergent. The University of Michigan survey had its current conditions index fall 5.8% month over month. The latest Conference Board survey, which was released on Tuesday, was the best report since October 2000.
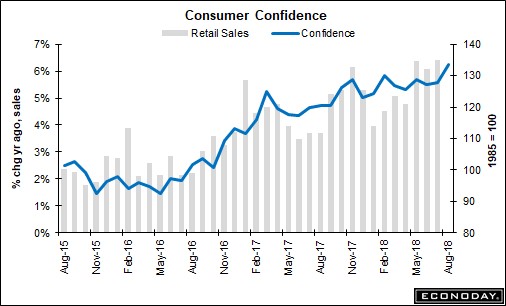
Supporting the Conference Board survey are the retail sales reports seen in the chart below. Supporting the University of Michigan survey, real wage growth has gone negative as inflation has perked up.
Studying these stats is clearly partially an art as there are always divergent points worth considering. The newest one this year was the wholesale change in the savings rate as it was moved much higher. This signals that the consumer isn’t overstretched like we thought.
It’s particularly remarkable to review these two surveys. The Michigan report led with the point that buying conditions for housing were the lowest since 2008. And, buying conditions for cars were the lowest in 4 years.
Consumer Confidence - Retail earnings from the top stores and overall retail sales didn’t jive with this weakness.
However, there has been some weakness in housing which should be taken seriously.
Specifically, the Conference Board index hit 133.4 which beat the high end of the consensus range which was 128.0. The average estimate was 126.8. The July report was revised up from 127.4 to 127.9.
Consumers are as confident now as during the height of the dot com bubble. That’s impressive, especially considering the fact that the stock market is on a sustainable path. Also, there aren’t many risks to a collapse in markets like how the last two cycles ended.
Both parts of the Conference Board index were different than the Michigan survey. The Michigan survey’s final result for August will be released on Friday. It’s possible it gets revised much higher.
The Conference Board survey had the Present Situation index improve from 166.1 to 172.2 and the expectations index increase from 102.4 to 107.6. As you can see, this survey is similar to the Michigan one in that they both have the present doing better than the future.
It implies the economy is near the end of the cycle. However, for now consumer spending should be good if it follows this report and not the Michigan one.
Delving into the details of the report, the percentage of consumers saying jobs are difficult to get decreased from 14.8% to 12.7%.
Consumer Confidence - This should make investors confident about the labor market.
I’m always wondering how full the labor market is because the unemployment rate doesn’t tell us about the decline in the labor force participation rate. The extremely low percentage of people saying it’s tough to get a job makes me think the labor force is close to being full.
The outlook on incomes increased 7.5% as optimism was up 5.1 points and pessimism was down 2.4 points.
This starkly disagrees with the negative real wage growth the consumer has recently had to deal with. Buying plans for autos, homes, and major appliances were all up. This part speaks to the dramatic differences with the Michigan survey.
Finally, the percentage of consumers bullish on stocks was up 2.2 points to 39.4%. Also, the percentage bearish fell 4.1 points to 24.5%.
That’s nearly a 2 to 1 ratio of bears to bulls.
It makes sense because stocks have had a great year. I expected the Michigan survey to be strong because of this recent positive action in stocks after the volatility in the winter and spring.
It’s not great for bulls to see that everyone is bullish, but this is the least of their worries as they should be more concerned with the labor market and consumer spending.
Consumer Confidence - Great Richmond Fed Report
The score was tied 2-2 with the regional Fed manufacturing reports as the Empire Fed and Dallas Fed reports were strong and the Philly Fed and the Kansas City Fed reports were weak.
The Richmond Fed is just a survey of a few manufacturers in that district. It is one part of the forecast for the ISM report. Because there were divergent results in the others reports this survey has more meaning than usual.
The Richmond Fed index was 24 which beat estimates for 19, was higher than last month’s reading of 20, and above the highest estimate of 20. To be clear the headline index is calculated by giving the new orders a 40% weighting, the shipments a 33% weighting, and the employment index a 27% weighting.
Volume of new orders increased from 22 to 25 and the backlog increased from 4 to 15. I would rather see a growing backlog with inflation than low demand and low inflation.
Luckily, we don’t have to choose with this report as capacity to utilization increased from 8 to 18 and price trends were lower.
The prices paid index was down from 3.54 to 3.31 and the prices received index fell from 2.24 to 1.58.
The chart below shows the final expectation for the Manufacturing ISM PMI which comes out on Tuesday September 4th.
As you can see, the PMI is expected to come in at about 57. The implied expectation was 55 before the strong Dallas Fed and Richmond Fed reports were released.
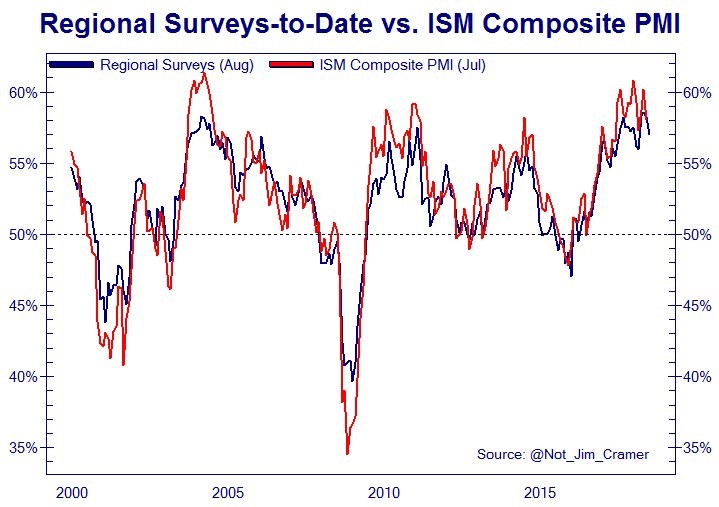
If the ISM PMI comes in at 57, then the party will keep on going for stocks because it doesn’t signal a slowdown is here. The core durable goods order strength in July paired with a solid August ISM PMI goes against my thesis which expects further weakness and a correction for stocks.
It also is against the weak flash Markit PMI reading. The Flash PMI only looks at the first two weeks. It’s not unheard of to see it reverse course in the final reading.
The expectations index fell from 44 to 42, but it’s still very strong. The expectation for new orders increased from 39 to 40. Expectations for equipment and software spending increased from 14 to 32.
Finally, the expectation for prices paid increased sharply from 2.84 to 3.24 and the expectation for the prices received fell from 2.74 to 2.63.