3rd Rally In A Row: Cloud Stocks Explode
On Wednesday, the S&P 500 rallied 0.5% as it looked to head into the holiday weekend on a winning streak. If the market rallies on Thursday, it will only be the 2nd 4 day winning streak in 5 months. Russell 2000 was actually down 0.97% as investors shunned energy and financials.
S&P energy sector was down 2.43% and the KBW regional bank index was down 4.17%. Wednesday was an amazing example of breadth tightening which means the end of the run in tech stocks is near. If only the momentum stocks are up, that means that’s where all the new money is headed. It’s the ultimate sign of investor herding.
Nasdaq continued its massive streak as it rose 0.95% to a new record high. It’s up 13.17% year to date and 25.5% yearly. It’s on pace for another fantastic year. This was the first record the Nasdaq had while the S&P 500 was 8% below its record since January 1980. Nasdaq is further ahead of the S&P 500 than it was in the 1990s tech bubble. And the only assets that outperformed the Nasdaq in Q2 were WTI oil and Brent oil.
Nasdaq rallies when the cyclicals do well and when they don’t. It rallies when investors fear COVID-19 getting worse and when they are excited about it getting better. And the Nasdaq and cloud stocks never fall. CLOU cloud ETF was up 3.08% as it is up 74% since the March bottom.
Shopify stock was up an enormous 6.97%, putting its market cap at $119.2 billion. It’s up 149% year to date. Tesla was up 3.69% as its market cap is now $207.55 billion which is higher than Toyota’s market cap. Its’ up 160% year to date.
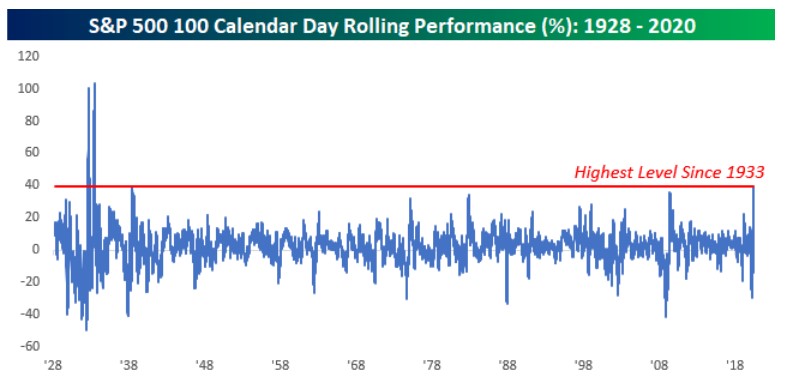
Best 100 Days Since 1933
It’s amazing that the Nasdaq has outperformed the S&P 500, especially considering the fact that the S&P 500 just had its best 100 days since 1933. You can see in the chart below, stocks only did better in the 1930s. Harping on the tech sector makes sense though because it’s a large reason why the market has done so well. Without the bubble stocks, the market wouldn’t be expensive. Problem is they represent about a third of the index. If they fall 30%, they bring the index down 10% and the Nasdaq down 15%.
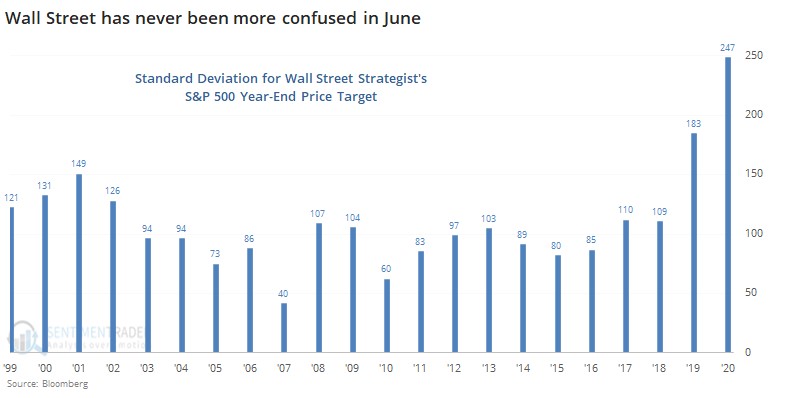
Most Uncertainty Ever
The chart below shows the standard deviation of Wall Street’s S&P 500 targets in June of each year. As you can see, the deviation is the highest ever. It's surpriseding that it was elevated in June of last year because that was a relatively calm year. Estimates didn’t vary by much in June 2008 probably because the real volatility didn’t start until the fall.
Average S&P 500 estimate for the end of the year is 2,998 which is 3.8% below the current price. That’s tied for the lowest ever price target in relation to the market in June because analysts are almost always bullish. Estimates will likely be raised in the next few weeks. That’s meaningless though. Estimates are probably low because stocks have done so well that analysts haven’t been able to raise them quickly enough.
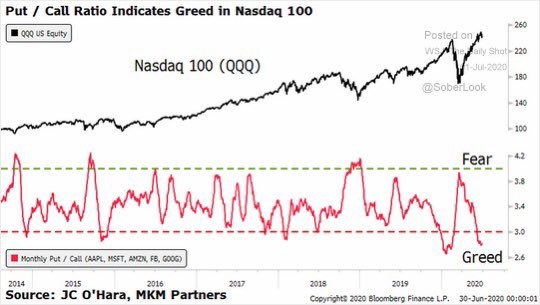
Extreme Put To Call Ratio
We are back to looking at the put to call ratio. Last time we reviewed it, the S&P 500 promptly corrected about 7%. This time we are looking at the Nasdaq’s put to call ratio. As you can see from the chart below, it is showing extreme greed. It’s showing almost as much greed as it was in February before the bear market.
It’s interesting because the tech stocks not in the Nasdaq 100 are showing even more greed. This is a party that’s near its end. Shopify has a 14 day RSI of 81.61 showing its very overbought. CLOU ETF’s 14 day RSI is at 69.61. Tesla’s is at 71.27.
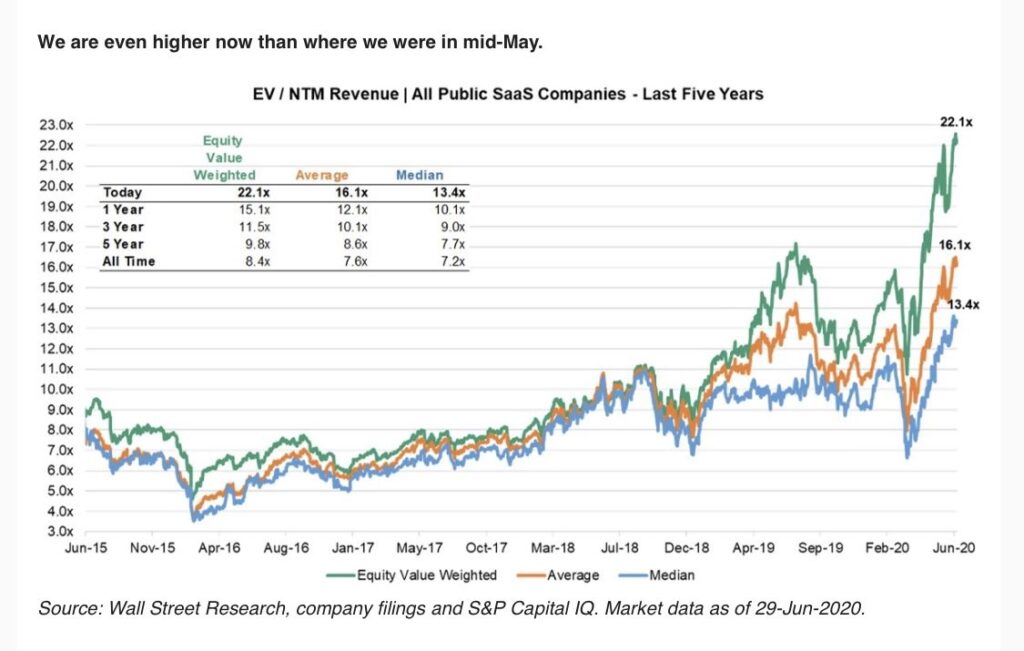
Extreme Valuations
Cloud stocks are overbought; this means they are expensive. As you can see from the chart below, the average enterprise value to future 1 year sales multiple for all public software as a service stocks is 16.1 which is more than double the all time average of 7.6 and almost double the 5 year average of 8.6.
Median future price to sales multiple was about 3.5 at the bottom in early 2016. It’s now at 13.4. These stocks are almost 4 times as expensive. They are much more expensive than they were before the Q4 2019 correction and they are even more expensive than they were in February. The entire bear market looks like a blip in this chart.
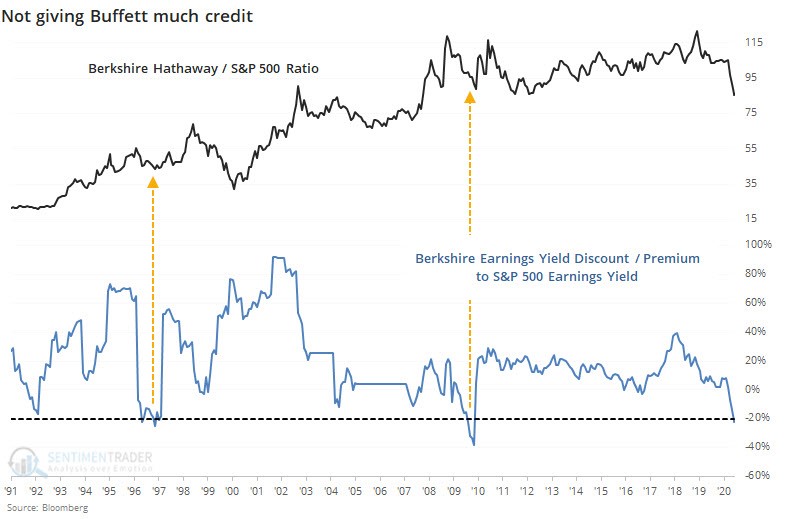
Buffett Hasn’t Lost His Touch
2020 is like a remake of 1999 as investors are claiming Warren Buffett has lost his touch. He hasn’t lost any skill. His portfolio has underperformed because it is interest rate sensitive and doesn’t have a lot of tech other than Apple which has been a huge winner. Apple has a 20% weighting in his portfolio.
As you’d expect, Berkshire Hathaway hasn’t done well in a market that loves growth tech names. Berkshire divided by the S&P 500 is at the same level it was at in 2008. All that outperformance for 12 years has vanished. Berkshire is trading at a 23% earnings yield discount to the S&P 500.
Since 1991, it has only been cheaper in relation to the stock market twice. It was cheaper in the late 1990s and in 2009. It’s trading at a greater discount than it was in 1999.
Conclusion
This has been the best 100 day rally for the S&P 500 since the 1930s. However, it is still being trounced by the tech heavy Nasdaq. Personally, I think the Nasdaq is in a bubble, and am calling for a 15% decline in the Nasdaq in which many of the speculative bubble stocks like Tesla and Shopify fall over 30%. Retail traders in these cloud stocks are about to be destroyed.