Auto sales were responsible for the weak durable goods orders in the GDP report. It could be the catalyst of a recession. Therefore, it’s critical to focus on every new data point available in the car market. The latest information we have is in the chart below. As you can see Nissan, Toyota, Fiat Chrysler, Ford, and GM all missed analysts’ expectations. All the firms which have reported so far have declining year over year sales. This will be the fourth straight month of declines. Some bulls have blamed tough comparisons for the decline in sales, but four straight declines makes it a trend in my opinion. GM, which has the highest sales in this chart, saw a 5.8% decline. GM’s inventories are now at a 9.5-year high. It has 935,758 units (100-day supply) in inventory which is the most since Nov. 2007, which was one month before the recession began.

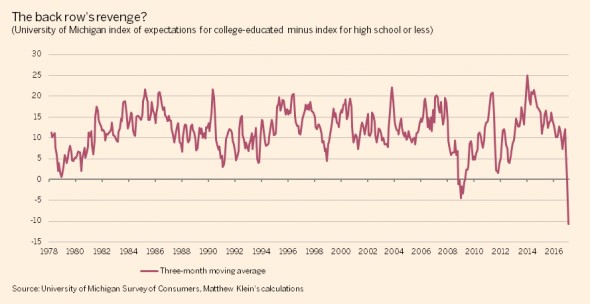
The car sales don’t match up with the consumer sentiment data as I’ve mentioned previously. It’s important to not look at this as a mixed bad. It is putting lipstick on a pig. The chart below provides an interesting way of breaking down the sentiment survey. I have discussed the difference between Democrats and Republicans in past articles. Democrats are very pessimistic and Republicans are very optimistic. The chart below shows how college educated people are much less optimistic than high school educated people. The only other time in the past 39 years this difference has been negative is during the depths of the financial crisis.
The takeaway from this chart can be these two possible options. Either the economy is once again in a weak state like in 2009 or the college educated people have historically been reflective of a more knowledgeable base, but now are reflecting partisan disagreements. In my opinion, it’s a combination of both. High school educated people are listening to the President talk up the economy even though GDP growth is weak. This is causing them to be overly optimistic. There hasn’t been a sharp decline in the economy which would make them realize they are wrong. It’s also true that there are more Democrats who are college educated. Some of them are partisans who are negative on the economy because their preferred candidate didn’t with the election. This is the wrong approach because Trump’s economic policies haven’t passed, so it’s not really his economy.
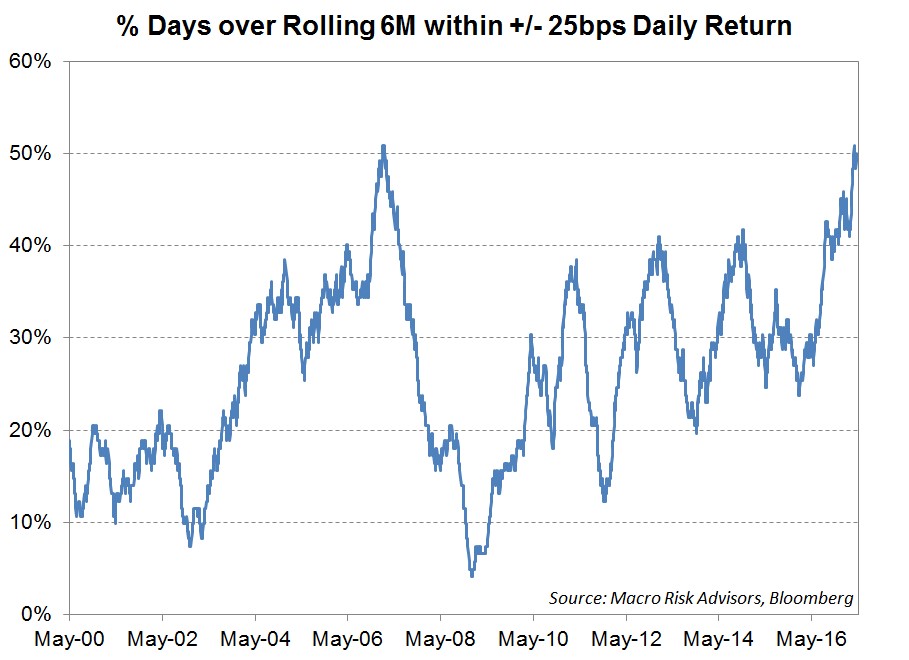
The VIX has been falling lately as the S&P 500 is within 1% of its all-time high. The Nasdaq hit a new record high on Tuesday. The VIX is currently at a 10 handle. It has been below 11 for 7 straight market days; it has only been below 11 in 16 days of this bull market prior to this recent run. While the VIX is low, it doesn’t adequately reflect the realized volatility shown below. As you can see, the percentage of days where the market has had within a 25-basis point move is about 50%. The only other time this has occurred in the past 17 years is in 2007 right before the financial crisis. This has been a long-lasting bubble as there have been three peaks in the chart where realized volatility has been subdued in this bull market.
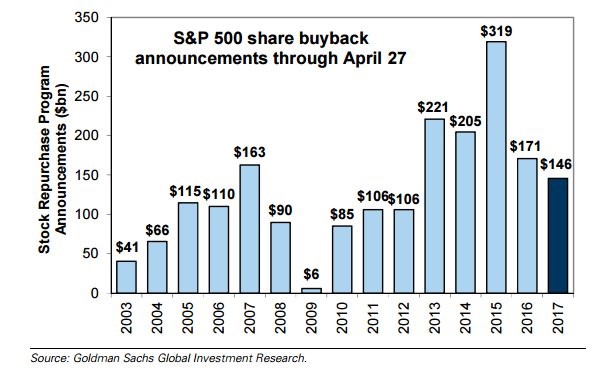
Earnings are expected to increase in Q1. There are signs that they will meet or exceed those expectations based on the 2/3rds of firms that have already reported. The chart below shows that the announced buybacks through April 27th are lower than in the same period in 2016. This is interesting because earnings have improved. The decline in 2016 makes sense because of the earnings recession, but I expected it to rebound this year. I still expect buybacks to improve even though I’m more bearish than the consensus on earnings. Usually when earnings increase, the money gets plugged into buybacks.
The elephant in the room is the repatriation tax holiday which will spur buybacks much higher. Multinational firms who have large cash hoards may be waiting to announce buy backs until after the holiday is put into action, so they don’t have to alter plans mid-way through them. Uncertainty tends to beget inactivity. It’s worth noting how stocks have been able to rally so strongly in the face of declining buybacks, since buybacks have driven the rally. Stocks fell after the weak data and declining buybacks in the beginning of 2016. The data is only slightly better than early 2016 if you look at the Citi Economic Surprise index.
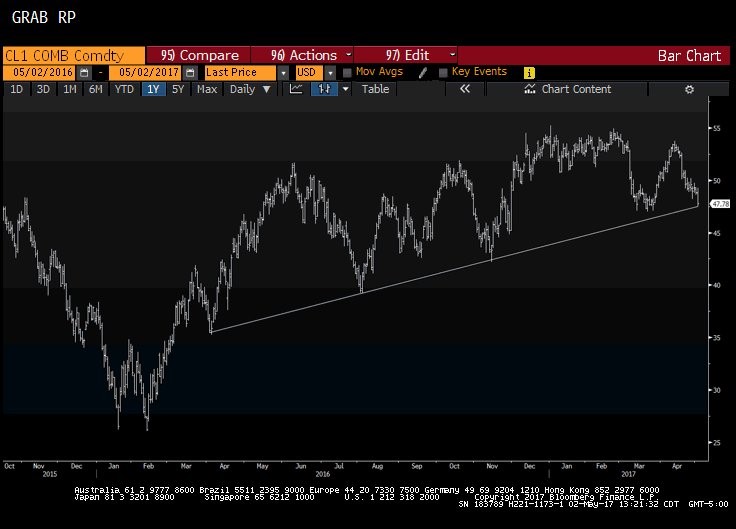
The final chart in this article shows the recent price action in oil. As you can see, the rally in April was a head fake as it has moved back to the lows of early March. I’m not much into technical analysis, but the chart shows support near the current price which implies a small move lower could catalyze a gap lower. One of the reasons oil has fallen is because of the increase in Libyan oil production. Libya’s production now exceeds 700,000 barrels per day. The fights between armed groups caused its two largest terminals to shut down. They have now opened in the past week. Production was 1.6 million barrels per day in 2011 before the uprising which shows Libya can up its production further if a more peaceful situation arises. The other catalyst of declining oil prices is speculation about what OPEC will decide to do with its cuts at its meeting on May 25th in Vienna.
Conclusion
The weak auto sales in April signify there will be further pressure on durable goods orders in Q2 2017. The current blue chip consensus for GDP growth in Q2 is 2.7%, but the data suggests this will come down shortly. I pay no attention to the Atlanta Fed’s model which expects 4.3% GDP growth because it is usually off the mark in the beginning of the quarter. If oil prices fall back to the high $30s like I have been projecting, growth may fall further. The chart below shows the latest spike in oil investments. These will fall when oil prices fall to the high $30s, pushing down the fixed investment portion of GDP.
