History of Candlestick Patterns
Candlestick Patterns were originally created in Japan during the 1700’s. They were used as a means of trading rice warehouse receipts—which represented the first-ever futures contract. They are referred to as candlestick, or candle, patterns because of the way the open, high, low and closing price is represented graphically. Candle patterns were unknown to the western world until the late 1980’s. The formations reflect not only the price, but the underlying psychology of the market as well.
Candle Body Construction
Candle charts provide the same information contained in other Western charts like the bar chart. However, the way they are graphically represented makes it easier to see the underlying prices more clearly.
The data represented are the opening price, the high for the day, the low for the day and the closing price, or OHLC. A shadow, or “wick,” is when the high or low extends beyond that of the opening or closing price. The length and direction of the shadow can be an indication of the future direction of the price.
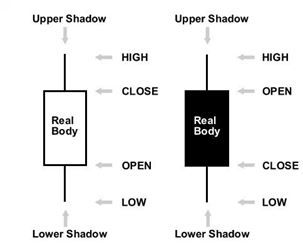
The real body is the part of the candle that is boxed in and represents the range between the high or low. If the box is “open,” or unshaded, it means that the price closed higher than it opened. If the box is “closed,” or shaded, it means that the price closed lower than the open.
The size of the body says a lot about the conviction of buyers or sellers. For example, a long closed (black) candle would be considered very bearish because the price closed significantly lower than where it opened. The opposite would be true of a long open (white) candle body. Conversely, a small white or black candle is an indication of indecision since the price closed near the open.
Candlestick Charting
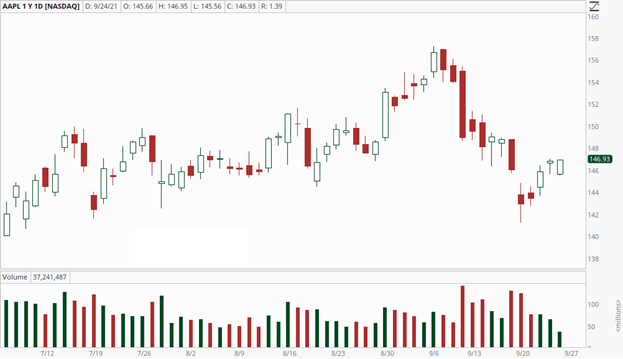
With most charting packages, you can add a color scheme to the candles based on whether the price closed higher or lower than the previous day or other factors. There are two primary candle chart types to consider.
Candle Chart—for a regular candle chart, the color of the candle is based on whether the close is above or below the open. If you have selected a red/green color scheme, the candle will be red if the current/closing price is below the open. The color of the candle body will be green if the current/closing price is above the opening price.
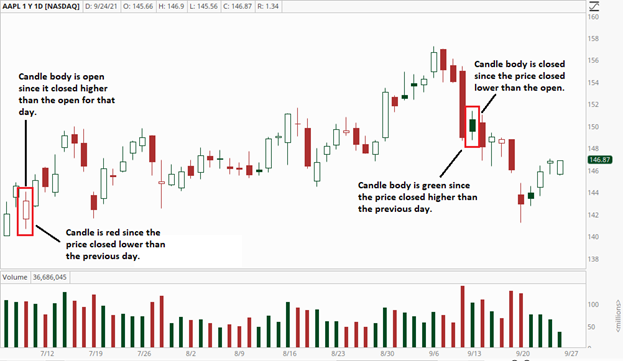
Candle Trend—for a candle trend chart, the color of the candle is based on whether the current or closing price of the current period is higher or lower than the previous period. If you have selected a red/green color scheme, the candle will be red if the current/closing price is below the previous period’s close. The candle will be green if the current/closing price is higher than the previous period’s closing price.
The candle will be closed if the current/closing price is below the open and have an open candle body if the current/closing price is higher than the open.
Conclusion
The purpose of a price chart is to see the day’s activity. While there are different types of charts, none of them provide the degree of insight into psychology more than candles. In addition to being able to see the OHLC more clearly, the candle trend chart provides even more depth. If you like watching charts, candles a maybe the best way to display price.
Wondering when to hedge? See how unlocking the Vomma Zone can help you better understand when volatility is about to rise.
Want learn more about how to work with me? Check out Trader by Your Side!
Not a subscriber? Become a TheoTrade member