
The SPDR S&P 500 ETF Trust (NYSEARCA: SPY) nearly formed a doji yesterday as the close was only slightly higher than the open. The early indication of balance reversed following the FOMC policy statement today. That's the early indication this pattern can provide. It's about balance after a sell-off and the exhaustion as the price rises.
Let's take a closer look at bullish Southern Doji's.
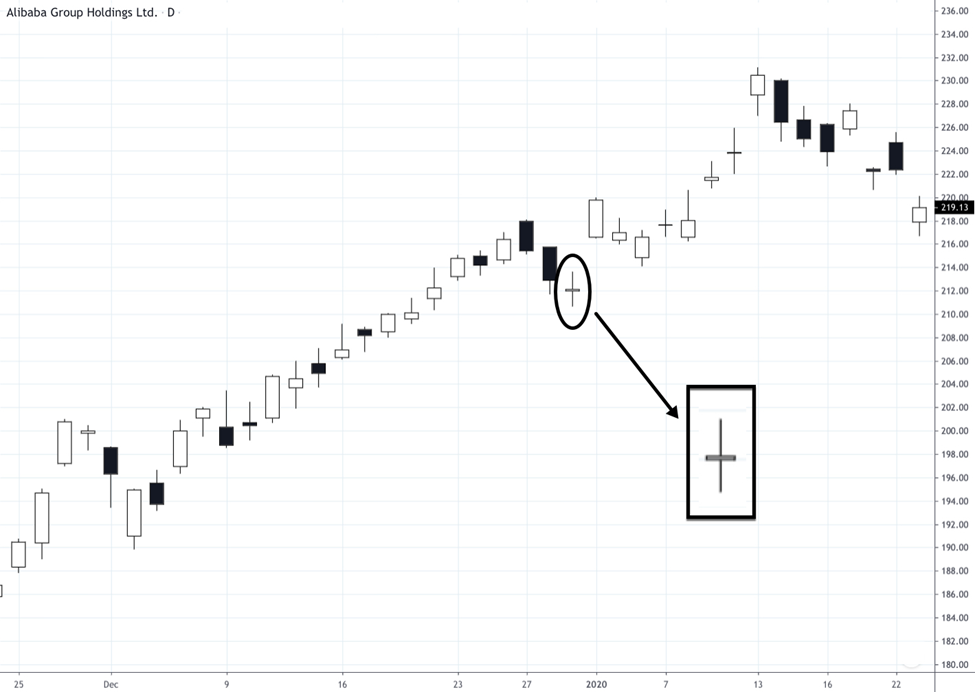
Doji (Southern) Basics
Overall Rating: 2 Star
Directional Bias: Bullish Reversal
Number of Candles: 1
Frequency Rating: 4 Star
Pattern Description:
The doji pattern forms at the tail end of a downtrend. The price opens and closes at the same price with similar length upper and lower shadows.
Volume Description:
Above average during the formation of the pattern and higher volume as the price closes higher the next day increases performance.
Statistical Notes:
Taller patterns with longer shadows typically perform better than shorter patterns. Since a doji represents balance between buyers and sellers, looking for a confirmation of a higher close the next day increases performance.
Measuring Technique:
Add the trading range of the doji to the high of the day.
Conclusion
The great thing about Doji's are their ability to identify areas of balance in the market price for a stock or other product. When balance is achieved following a falling trend, the early indication is that the price may reverse as the sellers become exhausted. As a result, Doji's can provide an early indication of a bullish reversal.
Wondering when to hedge? See how unlocking the Vomma Zone can help you better understand when volatility is about to rise.
Want learn more about how to work with me? Check out Trader by Your Side!
Not a subscriber? Become a TheoTrade member