
Sometimes the price can quickly reach an extreme after an opening gap lower. With Bullish Belt Hold patterns, the bears are quickly exhausted, and the price begins to advance to close near the high of the period. The ability to stage a significant intraday reversal higher is a strong tell that the bulls are now in charge.
Belt Hold (Bullish) Basics
Candles are all about identifying market psychology and the suppl/demand dynamic. The belt hold pattern comes following a period of selling where sellers have established control. To identify a trend reversal, the first point to consider is when the supply has exhausted. Establishing an opening gap lower requires an imbalance as the quantity supplied to the market is exceeding the demand. As a result, the market maker must adjust the price lower at the open. Unfortunately for the sellers, they represented the last of the supply imbalance and the price quickly finds an equilibrium. The rally higher builds a strong case for a reversal as the demand drives the price higher into the close.
Overall Rating: 2 Star
Directional Bias: Bullish Reversal
Number of Candles: 1
Frequency Rating: 4 Star
Pattern Description:
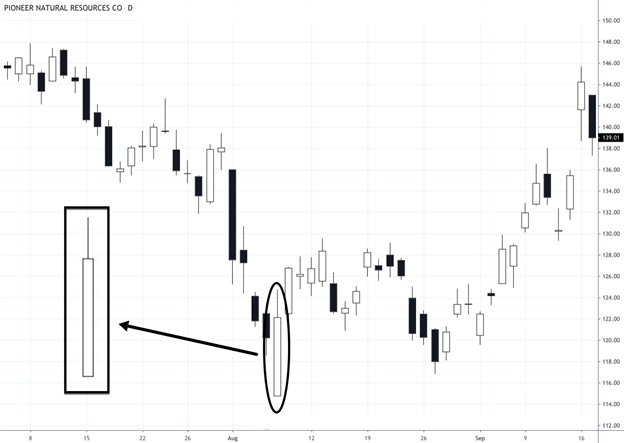
This belt hold pattern forms at the end of a down trend. The formation opens at the low of the candle and closes near the high, forming a tall open real body with no lower shadow. This pattern is similar to a white marubozu candle except that it appears following a downward price trend.
Volume Description:
Above average volume with increased volume as the price continues higher to form the belt hold typically outperforms.
Statistical Notes:
Belt Hold patterns where there is a large real body outperform smaller bodies. Formations with a neutral or up trending primary trend outperform.
Measuring Technique:
Measure the height of the formation from low to high and add it to the closing price.
Conclusion
Nobody likes to lose their pants and a good belt hold for your kimono is a must. As a trader, identifying a belt hold to enter on a reversal in the price is key. Having strong indications of exhaustion and an intraday reversal can provide enough assurance that your bullish trade can be supported is a must.
Wondering when to hedge? See how unlocking the Vomma Zone can help you better understand when volatility is about to rise.
Want learn more about how to work with me? Check out Trader by Your Side!
Not a subscriber? Become a TheoTrade member