The biggest problem with bearish charts is their using of GDP to measure valuations because GDP isn’t 100% correlated to earnings. If you start out when making a chart with the goal of having it prove a certain point, it’s easy to show whatever you want. Anyone can create a slide deck which shows the market is cheap or expensive. That doesn’t help anyone as shortcuts in life often don’t have good results. In this post, we’ll look at a misleading chart with bullish connotations.
The chart below is an interesting use of stats to misguide investors. As you can see, it shows that in this cycle, starting in 2007, the consumer has deleveraged more than any cycle since 1952. At first glance, this stat looks amazing because a deleveraged consumer means there’s pent up demand. The first obvious flaw to this logic is if the consumer has deleveraged, then why is it suddenly going to start taking on more debt in the next few years. In other words, if this cycle is so different, why will it suddenly reverse. What is the catalyst for new debt? Interest rates are already near historic lows and the labor market is already strong. We’ve seen in the last BLS report that weekly earnings are up 2.8%. With such good news, you would think there would have been more optimism in the past few years.
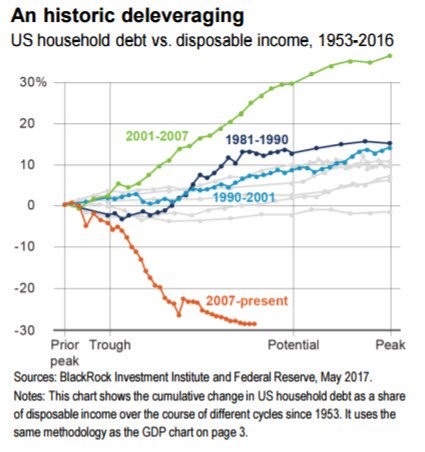
The answer to all these questions is that the years are cherry picked. The consumer was the most leveraged ever in 2007, so the leverage naturally came down. If you’re predicting a reversal to this trend, you’re betting on record leverage being revisited. That’s a fine claim to make, but it needs to be contextualized. Predicting that leverage would reach that point is predicting another housing bubble. The housing bubble is what created such excess debt as loan to value ratios were very high. Luckily banks learned their lesson; they aren’t giving out loans to anyone with a pulse. HELOC or home equity lines of credit aren’t being used as much.
In closing, you can’t compare the debt level to the highest level ever and say now it is low. It’s tough completely fact check where these numbers came from, but we have the chart below which runs counter to the ridiculous narrative that the consumer is swimming in cash. As you can see from the chart below, the U.S. household personal saving rate is near the level seen in 2007 prior to the financial crisis in 2008. As you can see, there was recently a revision to the savings data which lowers it substantially in the past 12 months.
It’s possible the chart above, which was made in May 2017, was using incorrect data. The concept that the consumer will take on more debt in the next year as the economy improves is plausible. However, you can’t claim the consumer has been saving for years and is about to splurge on new goods and services. Non-mortgage debt as a percentage of personal income is at a record high. Only 50% of millennials will earn more money than their parents. Only someone who is disconnected from reality would think the American consumer has money to burn. Rent expenses as a percent of GDP are at a record high. Where is this savings coming from?

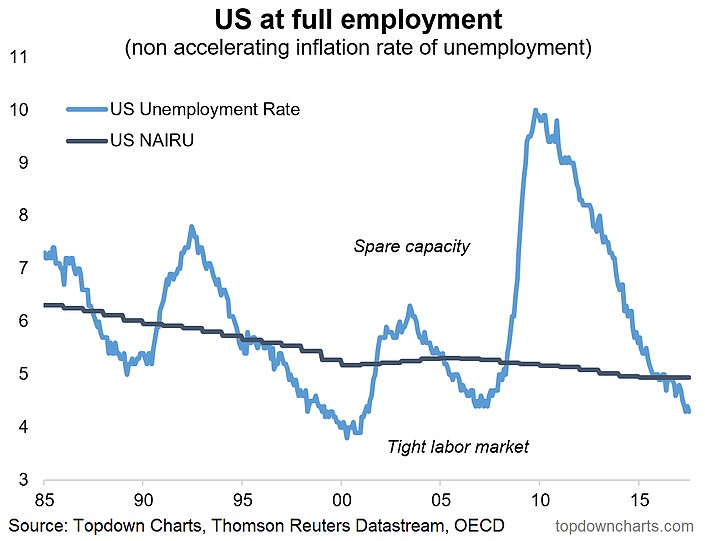
Besides making false conclusions, another problem with the premise of that bullish argument is that the economic recovery hasn’t started yet. It makes the case that there are several more years left in this business cycle as the economy is about to boom. While it’s possible the economy can avoid a recession in the next 4-5 years, it’s not likely. The chart below gives you an excellent take on the labor market cycle. It shows that the unemployment rate is below the Nonaccelerating Inflation Rate of Unemployment. That is a signal of a tight labor market. With the wage gains and the Fed raising rates, it’s not a surprise to say the economy is late-cycle. In the past few cycles, the labor market has stayed tight for a few years. So far, in this cycle the labor market has been tight for about a year. This would indicate the next recession is coming in 1-3 years. There won’t be a big burst in economic activity unless the Congress passes a large tax cut.
Probably the most obvious place which isn’t readying itself for another lift off is the stock market which has seen stellar performance in the past 10 months. The quote by Jim Paulsen details the enthusiasm. He says: “We've got a fully employed economy, rising real wages. We restarted the corporate earnings cycle. We've got strong confidence among business and consumers. The kick is we can do all of this without aggravating inflation and interest rates. If that's going to continue, I think the bull market could continue to forever.” This enthusiasm is quite insane as the concept of stocks increasing forever is almost impossible. There is still risk which can occur in the next 12 months regardless if Pollyannas can see it or not.
Conclusion
I try to bust the myths promoted by people who are biased to get to the truth. Obviously, finding out where the economy is going is an art and a science. Knocking out faulty conclusions is one way to get to the truth. When you apply a heavy level of skepticism to whatever you read, you are on the right path to finding the truth. In my estimation, the economy is not near a recession. However, claiming the consumer is about to go on a buying spree is ridiculous because savings rates are very low. Expecting another 4-5 years of economic growth is overly optimistic because the Fed is raising rates and the labor market is tightening. My forecast for when the next recession occurs remains dependent on Washington as fiscal stimulus can push off a recession by a year.