The stock market rallied on Friday again as most of the Wednesday weakness has been reversed. It’s possible that the issuance of a special prosecutor to look into the Russian interference in the 2016 presidential election calmed the markets down. It’s also possible that the market was simply due for some volatility and finally got it. After that volatility came, dip buyers stepped in once again. Friday the S&P 500 was up 0.68% and the VIX was down 17.87%. The stock market can’t even fall 2% without dip buyers swooping in. The spurt of volatility actually turned into a bullish catalyst because investors are desperate to get into the market on any correction since there hasn’t been a 2% daily drop in the S&P 500 all year and there hasn’t been a 5% correction in almost a year. Dip buyers have been rewarded every time in this bull cycle, so they will not be deterred by excessive valuations.
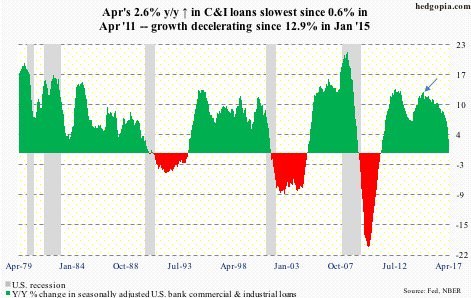
While the stock market ignored the latest weakness in C&I lending seen in the chart below, the bond market is paying closer attention. Since May 10th, the 10-year bond has fallen from 2.41% to 2.23%. As you can see, the deceleration in C&I lending led to growth slowing to the weakest rate since April 2011. It has been falling since January 2015. In the prior cycles, year over year growth went negative after the recession which indicates that the economy is likely near another recession.
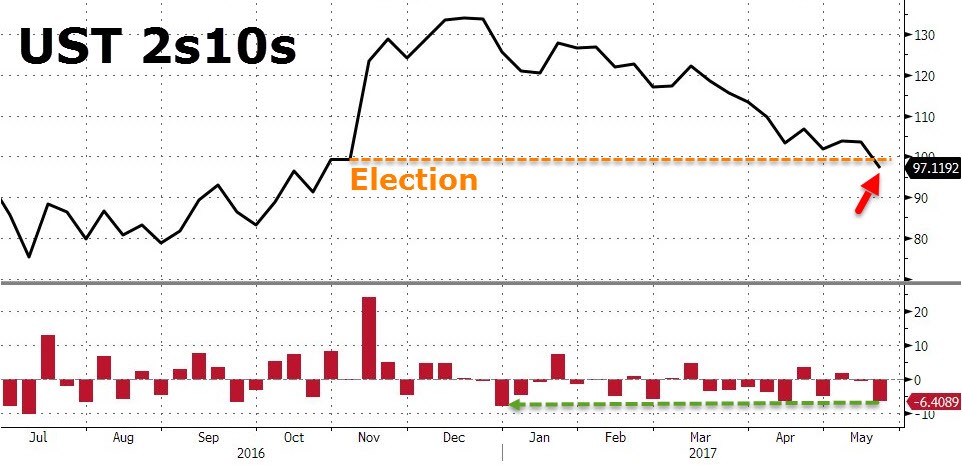
The difference between the two-year bond and the ten-year bond is indicative of where the fixed income market is predicting the economy is going. As you can see, the flattening yield curve shows the bond market is watching the C&I lending stats closely. The yield curve isn’t inverted yet which indicates a recession isn’t as imminent as the C&I lending growth rate would indicate. It’s rare for all the indicators to line up perfectly. By the time they all are flashing a recession, the economy is already in one and the market has fallen. That’s why it’s important to watch now as the bull market rages on.
While the President of the Cleveland Fed was very hawkish on Thursday. The St. Louis Fed President James Bullard was the opposite. His dovishness may have helped the rally along. Bullard said exactly what I said in my last article discussing the Cleveland Fed President’s remarks. He said inflation has surprised to the downside, therefore raising rates 3 times this year doesn’t make sense. Bullard is responding to the changes in the data. This may not mean anything because he’s not a voting member this year. He’s forecasting 1 more rate hike in 2017 and none in 2018 and 2019. Janet Yellen and the FOMC members who will likely vote in June for a rate hike can easily say that the inflation declines are transitory.
Bullard believes the Fed should hold off on being hawkish because the low unemployment rate won’t boost inflation. He may not recognize that low hourly earnings growth combined with negative productivity growth can excessively grow unit labor cost which may boost inflation.
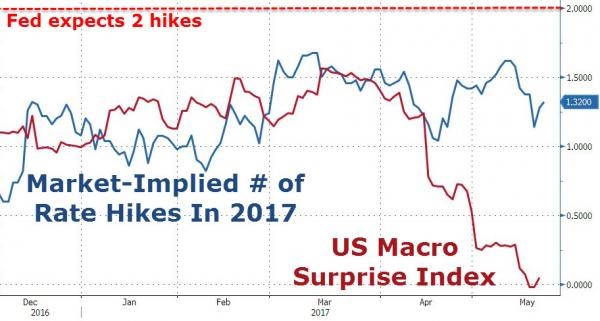
I can argue on both side of the decision because there’s supporting evidence for holding rates steady and hiking them. The market is projecting a 73.8% chance of a rate hike in June. The chart below shows the number of rate hikes the market is forecasting for the rest of the year. Now it’s at 1.32, meaning one more rate hike is more likely than two more. The market has been in that camp for months. The weakness in the U.S. macro surprise index hasn’t done much to move expectations likely because the Fed has ignored the latest weakness in CPI and GDP growth.
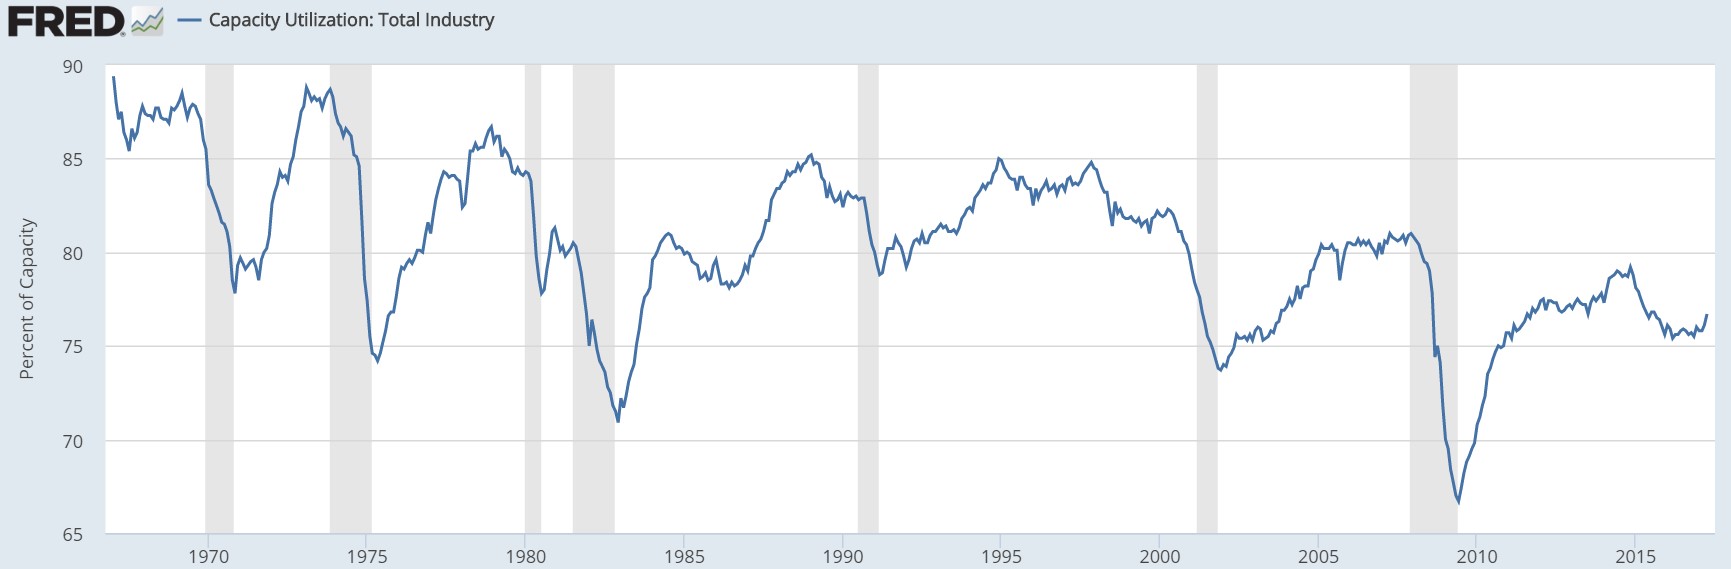
Speaking of GDP growth, it’s looking more likely that Q2 growth will be faster than Q1 as the NY Fed’s model is showing 2.1% growth. It’s still early in the quarter, but a 0.4% increase in the estimate this week, is a step in the right direction. The NY Fed’s boost in its projection was caused by the positive surprise in the industrial production and capacity utilization reports and was only slightly hurt by the disappointing housing data. The chart below shows the historical capacity to utilization rate. The capacity to utilization rate has been stubbornly low this entire recovery. While the recent boost in April still isn’t close to reaching the cycle peak in late November, it is a positive sign that private industry using its resources. The capacity to utilization rate in manufacturing was 75.9% which is 2.5% below its long-term average.
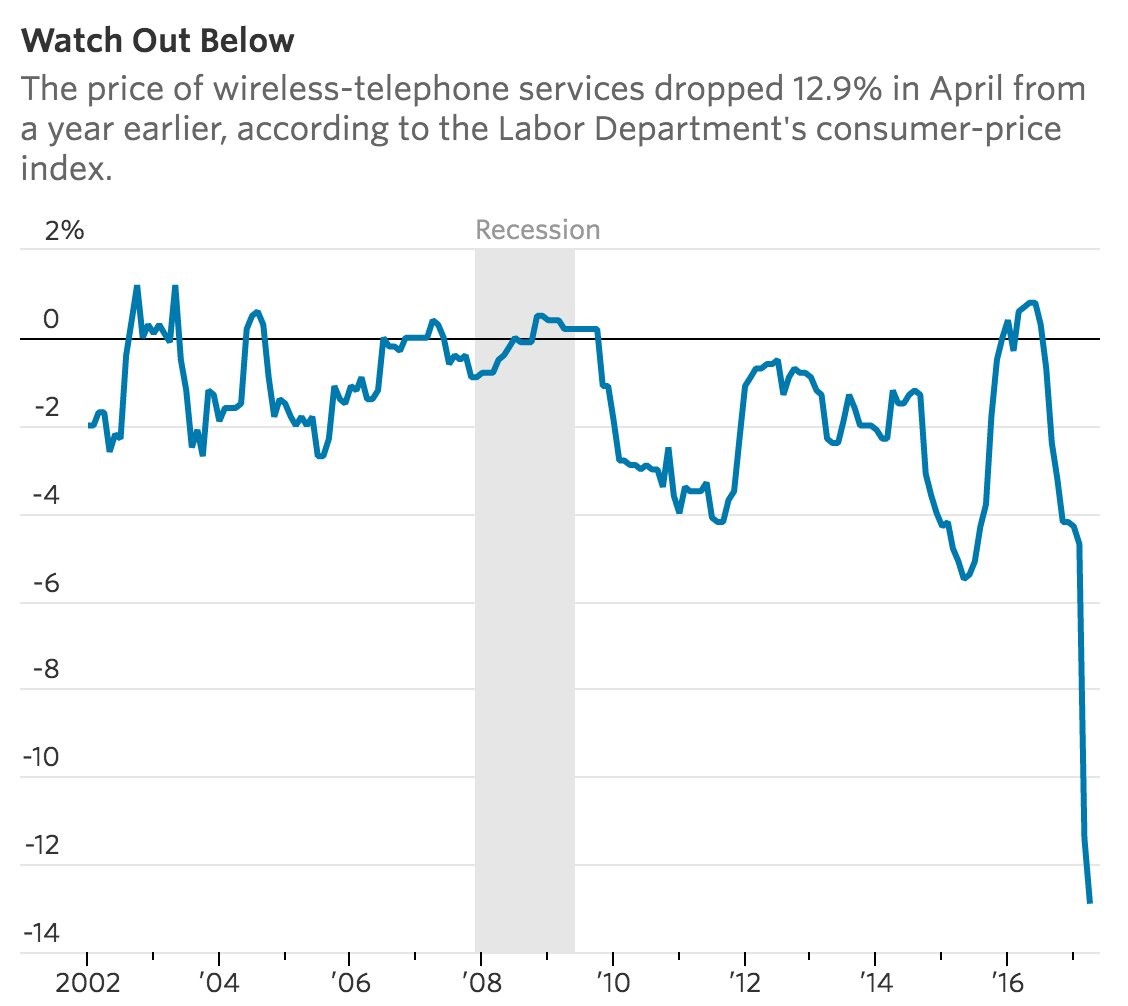
The Fed’s claim that the core CPI decline is transitory may have some merit because, as you can see from the chart below, half of the decline in core CPI this year has been caused by the decline in the price of wireless cellphone services. Costs dropped 12.9%. It’s unlikely that costs will fall off a cliff indefinitely given the major investments telecommunications firms are making in 5G networks. The last two dips in the chart below were followed by rebounds. If prices rebound again, we will likely see core CPI climb back above 2%. That would be consistent with the Fed’s goal of two more rate hikes this year. Obviously, the Fed is also banking on the prediction that another good/service won’t see a similar sized decline in prices.
Conclusion
Although the Citi Surprise index is falling off a cliff, the economic data was mixed this week because of the great industrial production report and capacity to utilization report. Bullard stated that the Fed shouldn’t raise rates as he may be expecting the decline in cell phone service costs to remain in place. He said he doesn’t think low inflation will be boosted by the tightening labor market. Regardless of what he says, the Fed seems to be likely to raise rates at the June meeting unless the May labor report is terrible. A rate hike in June will likely boost the odds of 3 rate hikes for the year.