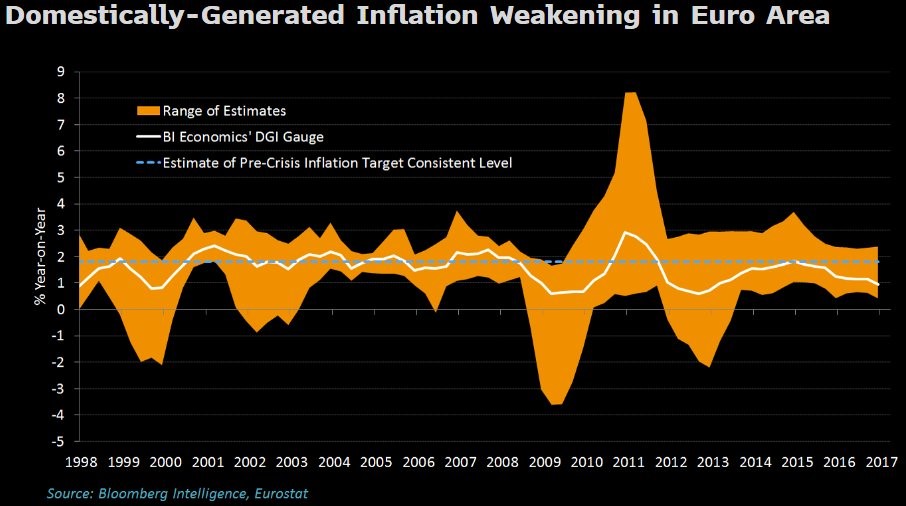
The Producer Price index increased 0.1% month over month, but on a year over year basis it fell from 2.4% in May to 2.0% in June. The decline was caused by the rise in oil prices dropping out of the metric. The core PPI was up 0.1% month over month and 1.9% year over year which is down from May’s 2.1% year over year increase. That’s below the Fed’s 2% inflation mandate, further adding to the number of inflation stats which show it below the mandate. The chart below is a unique measure of European inflation. Bloomberg argues domestically generated inflation is what matters. Regardless of whether it’s more important than regular measurements, it tells us where inflation is coming from.
As you can see, inflation is declining like in America and most estimates are below 2%. I don’t see why Europe has a 2% inflation target because one of the reason’s the Fed has it is because it can’t go to negative rates. The ECB is currently at negative rates, so that ship has sailed. Growth comes from productivity, not inflation. I consider the decline in inflation to be bullish for the chances of increased QE. The problem is if the ECB acknowledges that its QE doesn’t cause inflation, it makes it tough to subsequently argue for more QE to boost inflation.
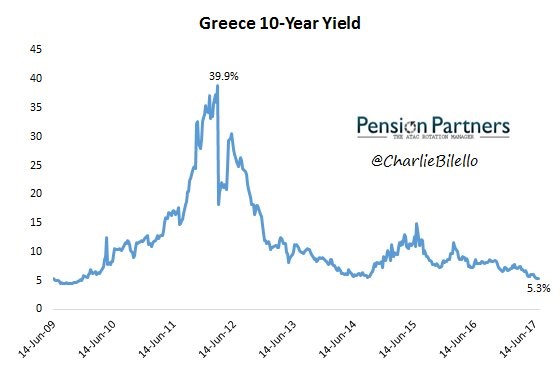
Along with the decline in inflation in Europe, the Greece 10-year bond yield is nearing pre-crisis levels. The ECB bond buying also has a hand in this. This chart is the ultimate depiction of the low yield environment and manipulation by central banks since the country’s debts are laughable. The debt to GDP in 2017 is 179% and it was 109.4% in 2008. Clearly the debts have no relation to the yields which only make sense in an interventionist low inflation environment. The manipulation of Greece’s yields are an indirect way to bailout the country as there’s no way it can stand on its own.
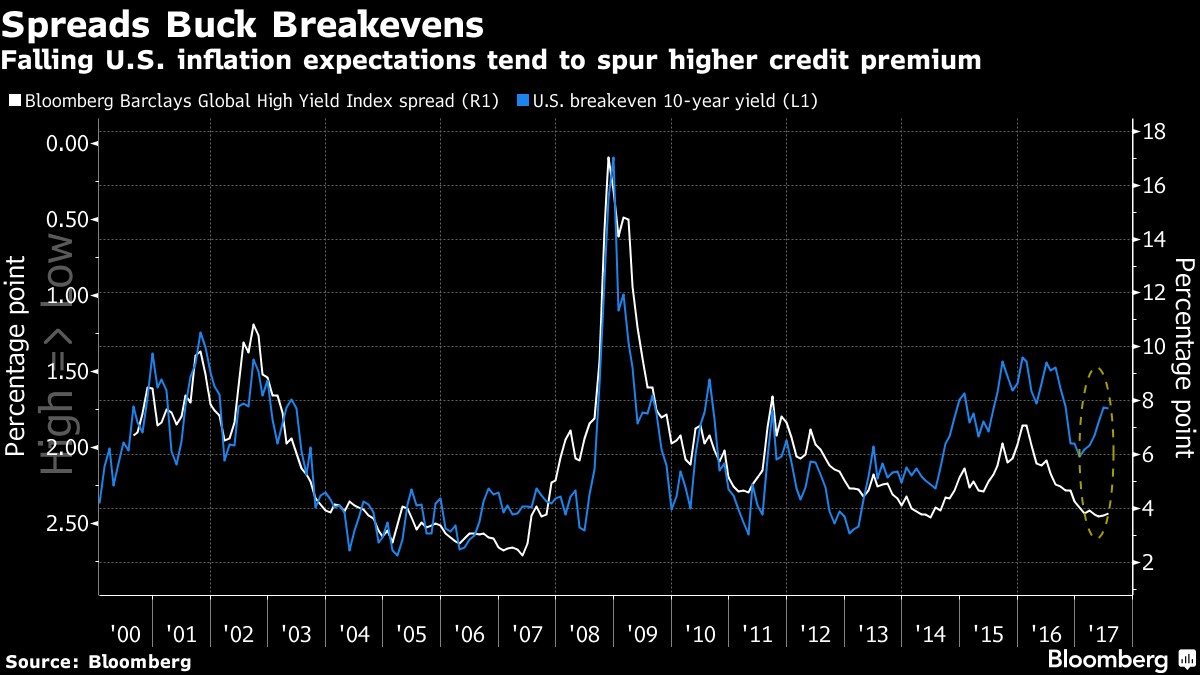
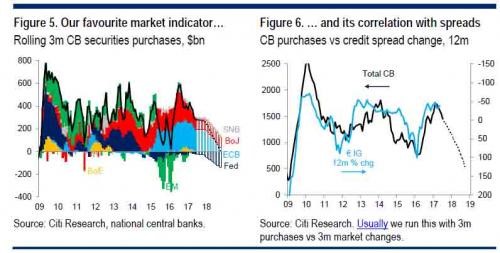
As you can see from the chart below, there has been a change in the normal relationship between inflation and the global high yield spread. Usually when the economy crashes, inflation falls and spreads rise. When the economy grows, inflation increases and spreads fall. Now inflation is falling, but spreads remain tight. That’s the ideal situation as it implies growth without price pressures. Unfortunately, reality isn’t that nice as the high yield spreads are less of an indicator of the economy now that the central banks have gotten more involved in the markets. Investors are in a risk on mode as the VIX fell below 10 today, but I wouldn’t use that to conclude the economy is very strong. It’s continuing its about 2% growth rate which is even lower on a per capita basis as the population grew 0.693% in 2016. In Q1 2017, real GDP per capital only grew 1.4%.
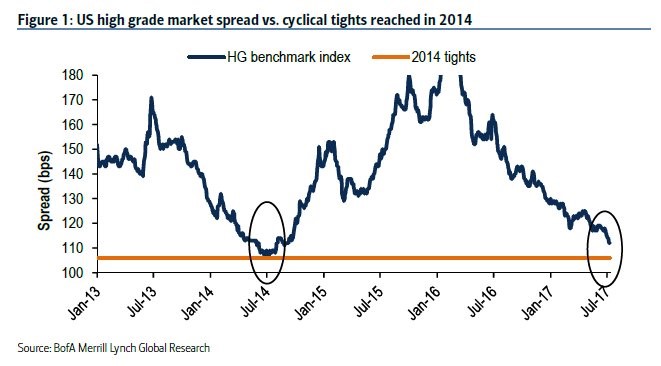
The chart below shows that the high-grade spreads are nearing the 2014 lows which is just in time for earnings to reach the 2014 highs. It’s 6 basis points away from the tightest level in 2014. The question of whether you think spreads are about to widen again depends more on where you think corporate earnings are going than where you think inflation is going. The correlation with inflation and spreads is caused by the relationship between inflation and GDP growth, but GDP growth doesn’t have a perfect correlation with earnings because 30% of S&P 500 revenues come from outside America.
The chart below shows the relative manipulation central banks have had on the bond market. The bond market is more manipulated now than ever before, making true price discovery difficult. This leads us to question what true prices should be. In future cycles, we’ll know what everything means, but for now we’re operating like a person in the dark fishing for a light switch. For example, I know that the yield curve is manipulated by Fed policy, but it’s not easy to tell how much and in which direction. I make my points using historical data, with the knowledge that it might be all hogwash because of Fed policy. Whether the Fed is buying treasuries or letting them expire, it is all manipulation. In fact, guidance alone affects prices.
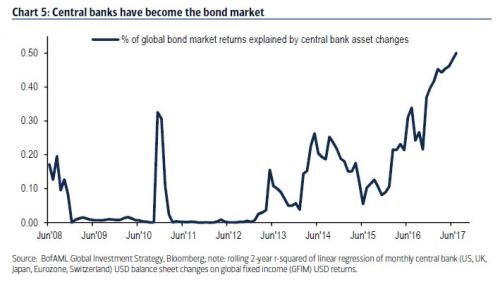
The obvious follow up question is when the latest bout of manipulation will cease and what that means. Overall, there is a trend for increased interventionism in the long term, but in the short term central banks want to scale back which is what could cause volatility in markets in the next 12 months. The market may want to overreact because if there is no selloff in stocks the unwinds and tapering may become more aggressive. Part of the reason for the QE was to push stock prices higher, but if they stay high without it then central banks will sweep the rug from under the market’s feet. We are getting closer to the moment where it begins. Even if you don’t own stocks or bonds or real estate, this will likely affect you as the underbelly of the market is revealed, otherwise known as free market price discovery.
Conclusion
The key point to understand is not that I’m making the grand proclamation that there will be a crash when the Fed starts to unwind its balance sheet. The point is that we don’t know what will happen. To investors the unknown is more difficult than the known headwinds. For example, it was easy to hedge the presidential election. While the result was surprising to some, it didn’t cause a crash because everyone knew the event was coming. It was easy to hedge by buying downside protection for that time. With the unwind, we don’t know when the market will be effected, by how much, and in which direction. That makes it impossible to hedge against which may be why the market isn’t reacting to anything. It’s in a ‘wait and see’ mode as investors calculate what the Fed and ECB will do before understanding what that means for markets.