No Government Shutdown
The deadline for the spending bill was December 22nd. If nothing passed there would be a government shutdown. On Thursday, the government averted this issue as the House passed another short term spending bill which lasts until January 19th. This means there won’t be volatility in the next week, but it also means we’ll need to follow this story next month. The bill included the $2.85 billion in funding for the Children’s Health Insurance Program that the Democrats wanted and $750 million for diabetes programs and community health centers. The GOP got what it wanted also as the funding plan also extended the Foreign Intelligence Surveillance Act program. It also gave $4.7 billion in funding to the Department of Defense to fund ship repair and the missile defense programs. My hope was that if the GOP and the Democrats compromised, they would pass a spending bill that lasts for the next year. Once the Senate passes this stopgap measure, the President will be able to sign the tax bill.
Epic Run Continues
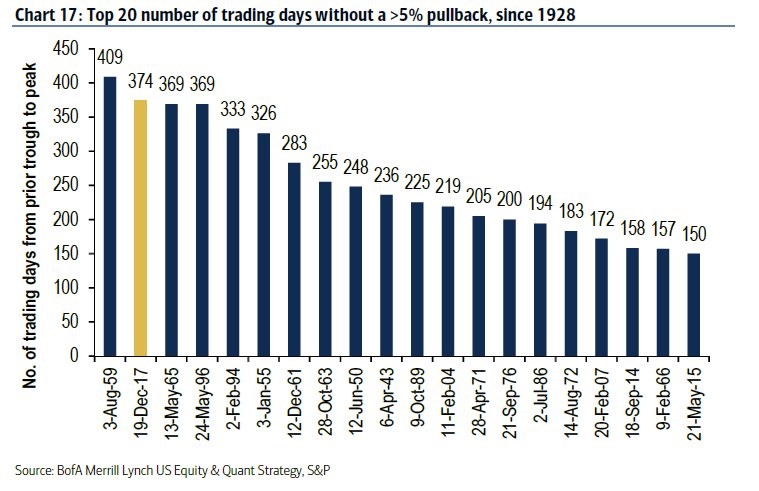
The stock market had another great day on Thursday as the S&P 500 was up 0.20% and the VIX was down 1.03% to 9.62. The CNN Fear & Greed index is at 71 out of 100 which means investors are greedy. Next year could break another record in terms of a lack of volatility. As you can see, there have been 374 trading days without a 5% correction. If this streak continues into February, it will break the record which ended in August 1959. Surprisingly, the one place where there hasn’t been greed this week is bitcoin as the price has fallen about $5,000 to about $14,600. This decline has extended to the altcoins as the total market cap of all the coins is $560 billion. Bitcoin’s dominance has fallen to 44%.
Valuations Are Absurd
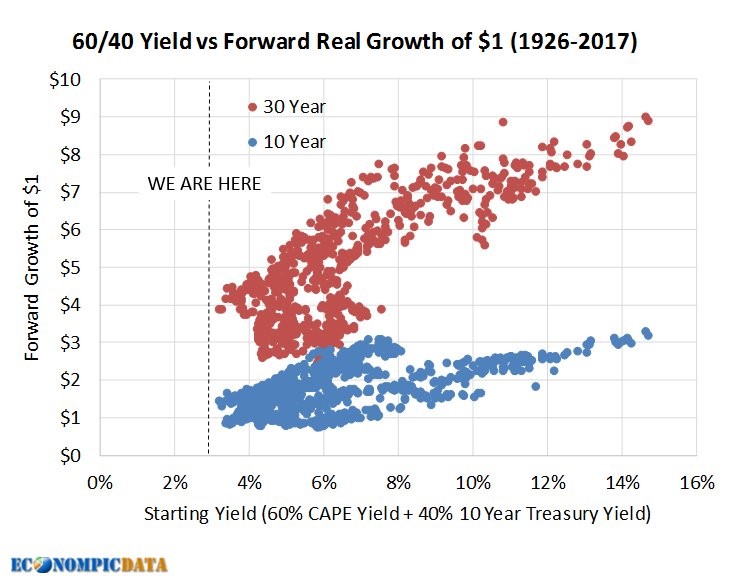
As I’ve discussed many times, valuations are very high. This means that long term returns will be low. The chart below is a mock portfolio with 60% stocks (using the CAPE yield) and 40% 10 year treasuries. As you can see, we’re in uncharted territory. The starting yield of this mock portfolio is below 3%. If you were to extend the blue dots toward the dotted line, you would get close to zero returns. The red dots are for 30 year returns. Valuations are less of an issue for this time frame. Keep in mind, that the beginning of this 30 year holding period will likely be rough. As you can see, the forward real growth of capital at these valuations over 30 years will likely be between double and quadruple the initial investment.
The Banks Are Loved
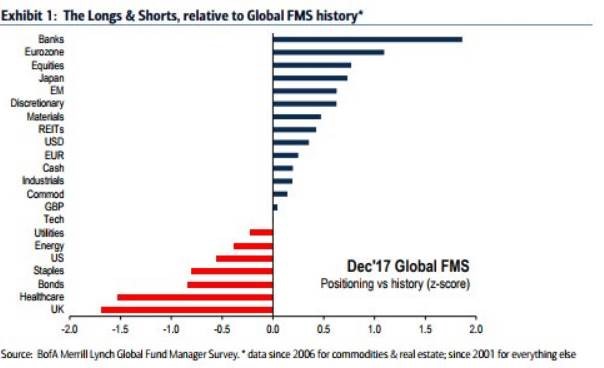
The fund manager’s survey which shows the z-score of various investments is consistent with some of the themes we have discussed. As you can see, the z-score in the banks in December is at about 2.0. that’s a strong signal they are over owned. As I’ve mentioned, the banks are great stocks to buy at this point in the cycle. Other investors have caught on to that theme and have been buying the banks hand over fist. The KRE regional bank ETF is up 6.84% in the past month and 10.61% in the past 3 months. On the other hand, U.K stocks have been sold by fund managers because of the uncertainty with the Brexit. It’s funny how this uncertainty was projected for 2018 even though the risk has already been realized. Many times when those types of lists are made, they reflect current risks more than future ones.
Inflation Starting To Pick Up
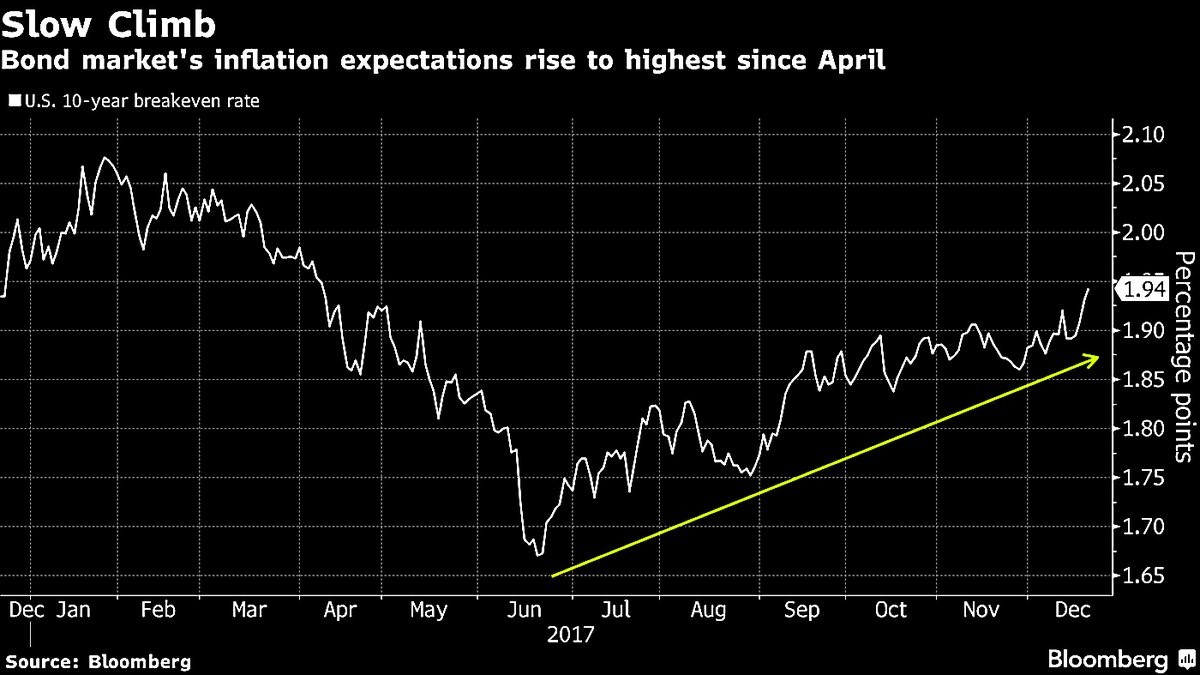
One of the key themes for 2018 is higher inflation. This can cause the bond market and the stock market to fall. The biggest prediction I’m willing to make based on this assumption is that the financial conditions index will reflect more stress than now. Since it is so low, that wouldn’t be a shock. The chart below shows that inflation is already starting to pick up. As you can see, the 10 year breakeven inflation rate has increases about 30 basis points to just under 2%. This is still below the peak of this cycle which was 2.64%, but it shows inflation is starting to heat up which is a sharp reversal from earlier this year. My expectation is for it to exceed the 2.64% at some point in 2018.
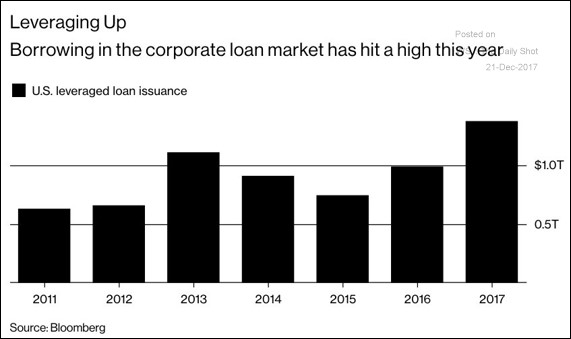
Leveraging Up
I’ve done a few articles where I’ve mentioned the prevalence of covenant lite loans. This is a potential black swan for the economy whenever the junk bond market goes south. We recently discussed how firms will be paying back debt with the money they have access to from the repatriation tax holiday. Given the investor desperation for junk bonds, it’s not surprising to see the information in the chart below. As you can see, the borrowing in the corporate leveraged loan market is $1.4 trillion. The previous high was $1.1 trillion in 2013. The $1.4 trillion represents a 46% increase from last year. This borrowing looks to be a leading indicator because it was high in 2013 and the economy was strong in 2014. It fell in 2014 and 2015 and the economy was weak in 2015 and 2016. Finally, it increased in 2016 and 2017 and the economy has been strong in 2017. This leads us to believe 2018 will be another strong economic year. The average yield in the corporate loan market bottomed in March 2017 at 5.09%. In the past few months, it has been stable as the average yield in November was 5.40%
Conclusion
The debt market and stock market have been exhibiting exuberance. While there is no evidence that would lead us to believe there will be an economic slowdown or even a 5% correction in the stock market in the next 6 months, in the long term, there probably will be low returns for risky bonds and stocks. The key is to buy after the selloff, so you can capture great long term returns.