Slack In The Labor Market
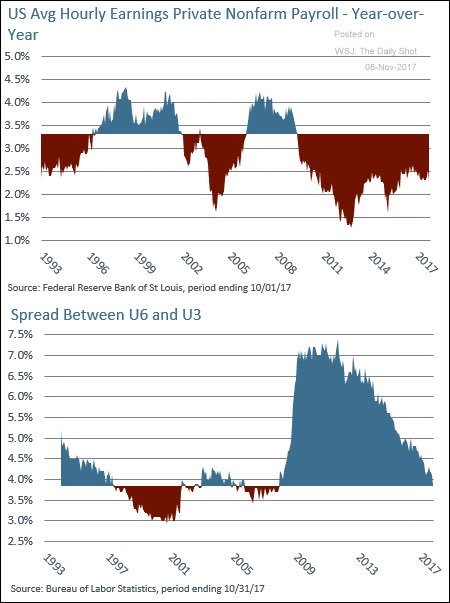
We’ve discussed wage growth in many articles. The chart below is a great depiction of what might occur in the next few months. It shows the spread between the U6 unemployment rate and the U3 unemployment rate. This shows the amount of people who are underemployed. The axis where the colors reverse is at 4% because there’s always going to be some workers in that category. When there’s less than 4%, it signals wage growth will accelerate. When there’s more than 4%, it signals wage growth will stay low. As you can see, the point where the colors change in the top chart is about 3.3% which shows that whenever the slack is low, wage growth is more than 3.3% and whenever the slack is high, growth is below 3.3%. With the slack about to be completely diminished, it looks like wage growth will get closer to 3% and eventually go above 3.3%. That would be a catalyst for core inflation to jump above the 2015 high. We discussed how Morgan Stanley expects core PCE to stay below the previous high. I’m not sure what they expect wage growth to be, but wage growth will definitely heat up inflation and cause the Fed to raise rates again.
Bitcoin Explodes
In the past I’ve recommended bitcoin, but with its meteoric rise, it’s time to avoid it completely. There’s no reason to buy into something that rises this quickly. There’s no question it will fall back down as speculators take profits. Many people will be willing to sell as it falls because they will want to lock in their gains. The story of bitcoin is interesting because it can’t be devalued like fiat currencies. However, the usage hasn’t increased enough this year to justify its price increase. Because using it to buy things is effectively selling the cryptocurrency, the size of the price increase might be discouraging people for using it. The speculative frenzy is the least interesting part about bitcoin.
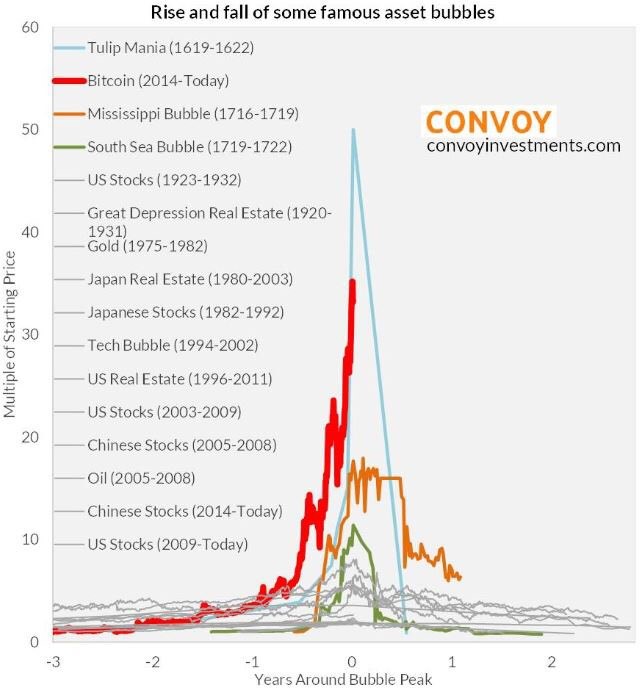
The crash that’s coming could end up doing more damage than good. It was thought that the older it got and the larger it got, the less volatility there would be. That doesn’t look like a valid argument with this latest action. The chart below compares the rise to other speculative bubbles. I think it’s cool because it isn’t easy to find information on the older asset bubbles. As you can see, bitcoin is closing in on the tulip mania which is the largest bubble ever. When bitcoin falls, it might have domino effects on other assets as people sell their stocks to cover the losses in bitcoin. Bitcoin is now over worth over $100 billion which means it’s about the size of a large cap stock. The bigger it gets, the bigger the effect on other assets once it crashes back down to earth. I think the crash will come sooner than later. Futures trading is coming in a month. That could catalyze the final leg higher. TINA investing has found a new home outside of stocks.
Effects Of The ECB Taper
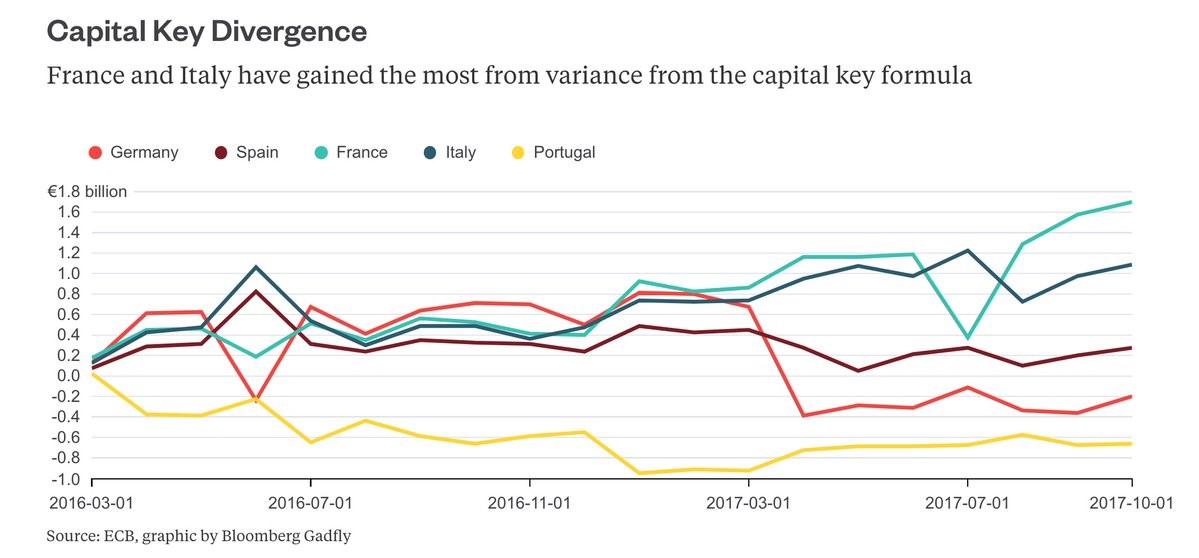
The ECB tapering will start in 6 weeks as the bond buying gets cut in half. The chart below shows France and Italy have been benefiting the most from the bond buying. Italy is having an election in March, so the ECB won’t be able to calm the markets as much if an unforeseen party is elected to control the government. In the past few weeks, Italian bonds have been fine as the Italian 10 year bond yield has fallen to 1.8%. That’s over 50 basis points below the American 10 year bond. The Italian bonds should price in more risk, but on the other hand, Italy is an older country. Aging demographics push interest rates lower.
There’s also an impact from the ECB buying. The question is how much it’s pushing the yields down. You would think the bond market would price in the change now that the plan is in place for 2018. The news of this week is that the amount of bonds the ECB can buy in 2018 through its reinvestment plan is 8.5 billion euros which is below the expectation of 12 billion euros. The bonds that need to be reinvested, must be the same ones. The ECB can’t replace German bonds with Italian bonds which it would otherwise want to do if there’s any political strife. The biggest effect of the tapering might be on politics and not on inflation or bond prices. The QE created stability in Italy, so we might be in for instability in the next few years. QE is set up as an economic policy. Therefore, I don’t think the ECB could use political issues to justify another round of QE. Even with the economic recovery, issues in Italy still fester as the youth unemployment in southern Italy, especially Sicily, drives a political wedge in the country.
Bankruptcies Stabilize
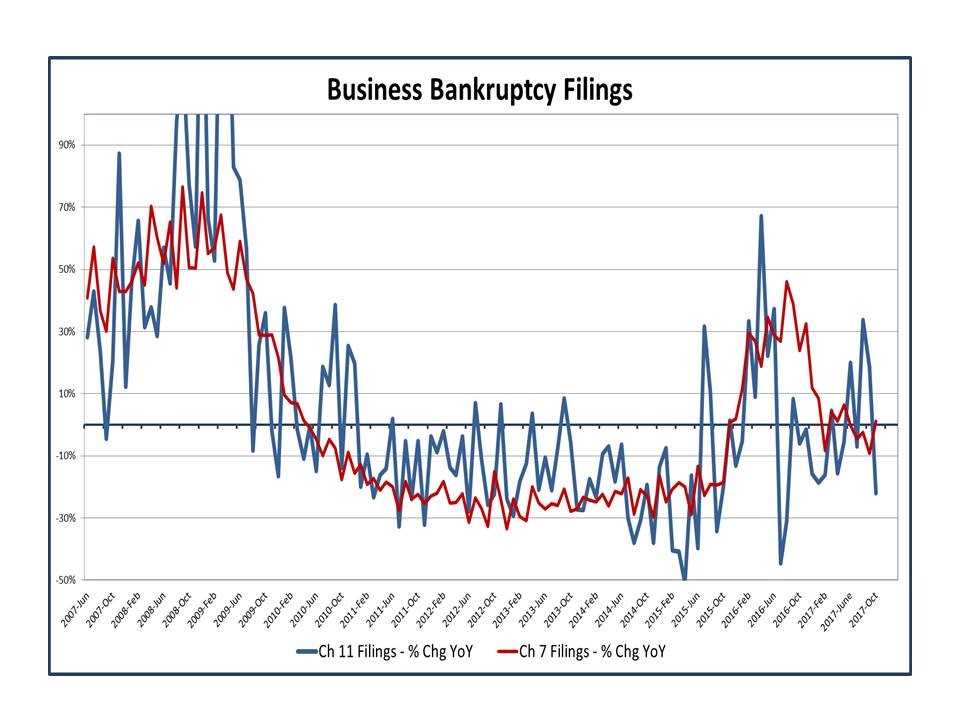
The chart below shows the chapter 7 and chapter 11 bankruptcies. As you can see, the bankruptcies have flatlined in the past few months after there was a spike in 2016. The year over year change this year is partially due to base effects. It will be interesting to see what happens in 2018 when these base effects don’t exist. I’m surprised there are this many bankruptcies considering how forgiving the credit markets have been this year. There is a popular argument popping up in bearish circles about how high yield debt is selling off. I’m not concerned with a minor selloff as the ‘risk on’ trade doesn’t always occur in perfect tandem. There has also been a selloff in microcaps which makes sense because the rally in September was ridiculous. It’s down 4.74% from the peak in early October.
Conclusion
The biggest test of 2018 will be if financial conditions are able to stay this easy as the Fed continues to raise rates and the ECB tapers its QE. If conditions tighten, it could lead to stocks falling along with high yield debt and microcaps. As for the rest of this year, I expect stocks to finish out the year strong as stocks have rallied 16 of the past 17 times they were up 15% or more year to date by Halloween.