Insanity Reins Supreme
Wednesday was the craziest day in the stock market most of us have ever seen. Salesforce.com’s earnings report caused a tidal wave of buying in everything tech related. Frankly, the action made no sense. This is a bubble. Netflix’s stock rose 11.6% and Roku’s stock rose 11.2% on analyst upgrades.
Analysts are basically making the numbers up as they go along. This is ‘garbage in garbage out.’ The table below shows the market cap gains of each of the big tech stocks. These 7 firms added $300 billion in market cap in 1 day.
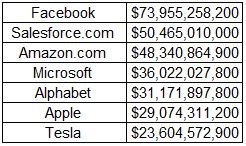
Somehow Facebook’s report that iOS 14 can hurt its Network Audience revenue by 50% led to its stock rising 8.2% to a new record high. This could be the next $1 trillion company. At this rate, it could reach that milestone next month. Before this rally, Facebook was the most reasonably valued big tech stock.
Speculators want to make sure no tech stock is even close to reasonably valued. The stock now has a 30.3 forward PE ratio. It’s certainly not cheap. Amazon was up 2.9% to a record high. Salesforce.com’s stock was up 26% to a record high. It even caused Alteryx’s stock to rise 9.7%. No one cares that Alteryx had a bad quarter. There is a mad dash to buy all the tech stocks at any price.
Nasdaq’s Bubble Gets Bigger
Nasdaq is in a huge bubble unlike anything I’ve ever seen. In some cases, this is worse than the 1990s bubble. It was up 1.73% on Wednesday. And, the cloud index hit a new record high as it was up 5.5%. Most people expected a rally, were surprised at how big this bubble grew in one day.
Nasdaq is up 30% year to date, while the Dow is down slightly. And Nasdaq is on a 5 day winning streak in which it is up 4.6%. The longer this streak lasts, the more likely this will be the end of its run. If you’re a bear, you should hope this streak lasts another few days. Nasdaq is up 48.5% from last year.
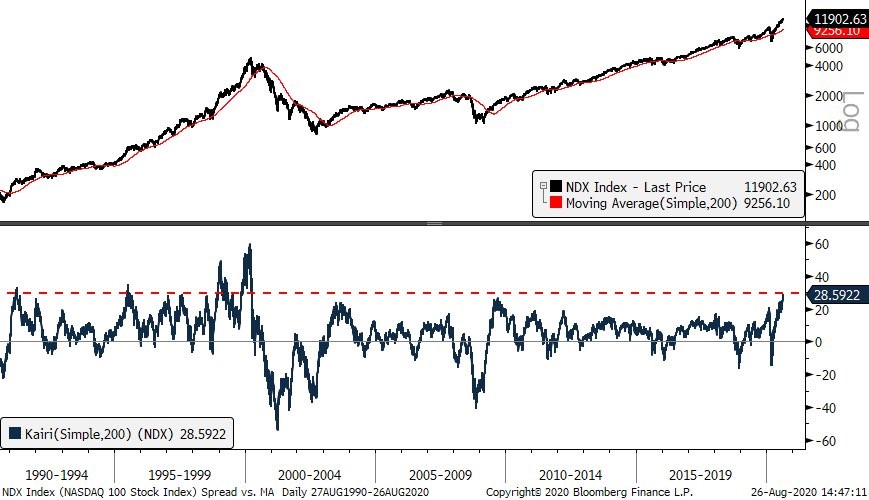
As you can see from the chart above, the Nasdaq is 28% above its 200 day moving average which is the widest spread since 2000. It was 60% at the peak in 2000. The S&P 500 was up 1%. It’s up 6% this month, but only 8 out of 18 days have had positive breadth. A rally has come from the tech stocks. This weak breadth is just like early in 2000. That was right before the peak in March.
Value Stocks Are Stuck
Even though we got better news on COVID-19 testing and another decline in new cases even though kids have gone back to school, cyclical stocks did terribly. Russell 2000 was down 0.7%. Only times the Nasdaq 100 was up more than 2% and the Russell 2000 was down more than 0.5% were in 2000, 2001, and 2002.
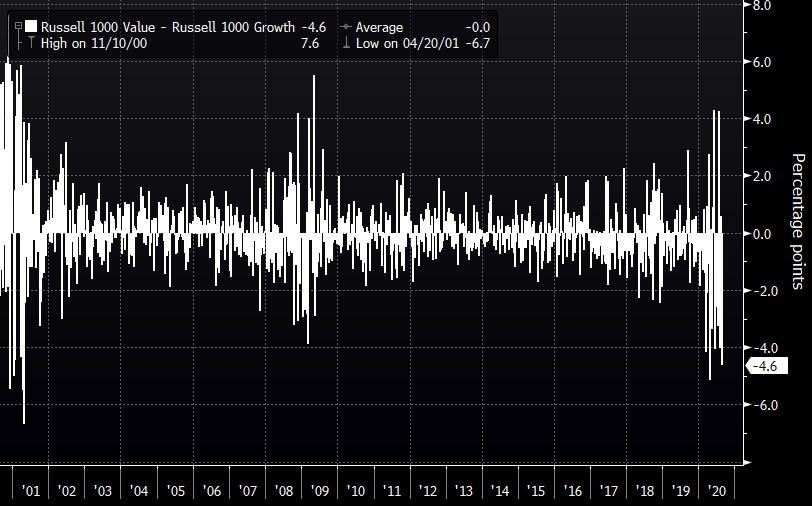
It happened 8 times in the past 30 years. Small cap value stocks were down 1.1%. The index is down 3.1% since August 11th. In that same period, the Nasdaq 100 is up 10.1%. As you can see from the chart below, the Russell 1000 value is having its worst week versus the Russell 1000 growth since April. It’s the 2nd worst week since April 2001.
Nasdaq Can’t Possibly Fall
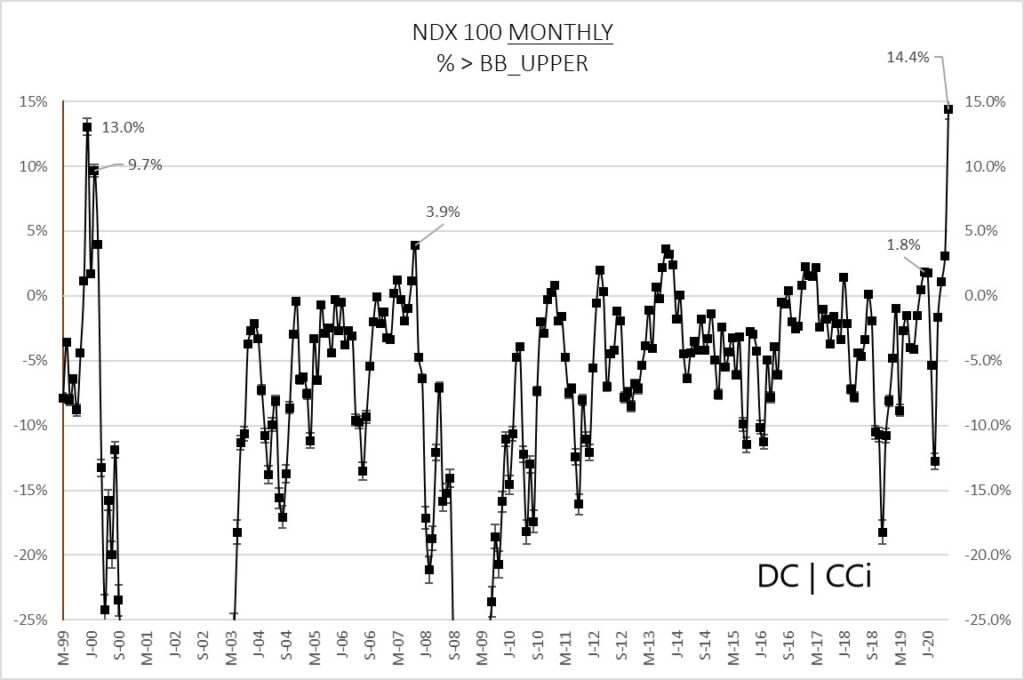
In the past few months, the Nasdaq has been impenetrable. Nothing can stop it. As I mentioned earlier, there are some aspects of this market that make it more extreme than the 1990s bubble. The chart below is an example of one of those figures.
As you can see, the monthly percentage of the Nasdaq 100 that is above its upper Bollinger Band is 14.4%. That’s higher than the 1990s tech bubble which peaked at 13%. Adobe stock was up 9.1% and Shopify was up 5%.
Tesla was up 6.4% which gave it a $401.3 billion market cap. It’s now above Johnson and Johnson which is the biggest stock in the healthcare sector. The stock is up 56.7% since it announced its split. The split already went into place. It will be shown in the stock on Monday.
Battery Day is going to disappoint investors because the million-mile battery already exists. Tesla can’t announce it. Anyone can use it. Since that announcement is immaterial, the next best thing would be Tesla announcing it is making its own batteries.
Unreal Euphoria
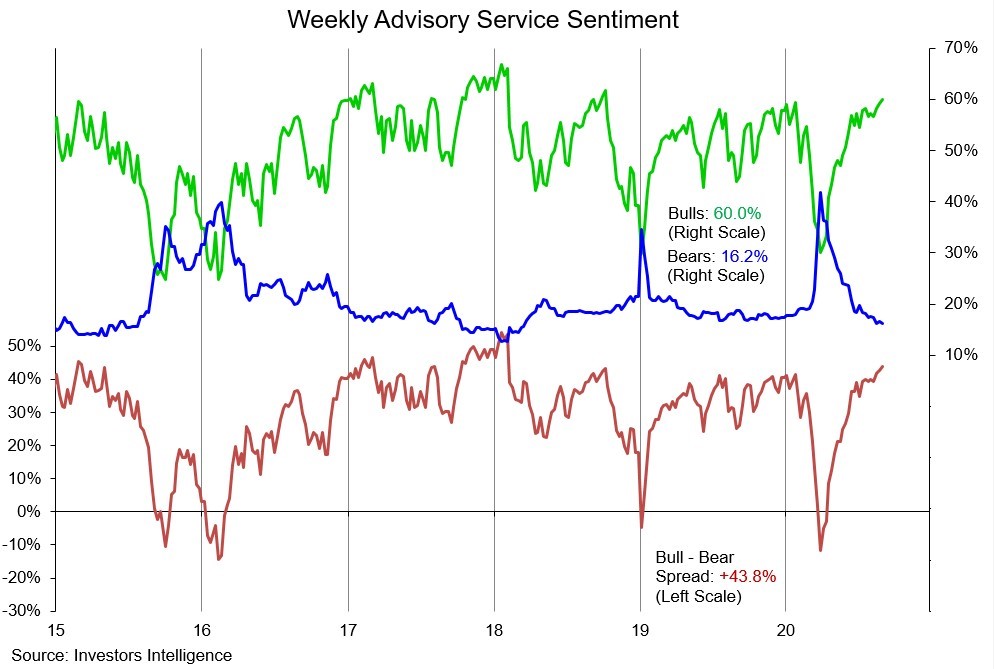
CNN fear and greed index rose 2 points to 75 which is extreme greed. Put to call ratio fell to 0.39. As you can see from the chart below, the AAII advisory weekly sentiment index has a bull bear spread of 43.8% which is the highest since February 2018. That was the month the short VIX trade exploded. If the stock market rises another week, the spread will likely beat the January 2018 peak.
On the other side, the individual investor survey’s streak of more bears than bulls extended to another record. This record is so far ahead of any other, it will likely never be surpassed. The gap shrunk as the percentage of bulls rose 1.7% to 32.1% and the percentage of bears fell 2.8% to 39.6%.
It's hard to believe that a further rally will make the percentage of bears fall below the percentage of bulls because so many people believe this is a bubble. We need a correction to convert the stubborn bears. They are stubborn because they have been bearish for a few months.
You really shouldn’t wait for this index to signal euphoria before getting bearish. Clearly, retail traders are very bullish. This survey doesn’t reflect the record number of new online brokerage accounts created. People are making so much money, they are saying they will never go back to work. A few have their entire net worth in Tesla stock.