Another New Record High - Big Friday Rally Caps Off Solid Week
The stock market increased again with on Friday with Another New Record High as this spectacular year continued. S&P 500 was up 0.46%, Nasdaq was up 0.59%, and Russell 2000 was up 0.78%.
S&P 500 is finally exiting the triple top area it had previously gotten stuck at. It has broken through its ceiling which means most technical analysts are probably bullish.
The S&P 500 is up 2.3% from its peak in April and 4.9% from its January 2018 peak. I had previously said it needed to get about 5% above that peak to count as a breakout.
Buy The Record High
Another New Record High - On Friday, the Dow, the Nasdaq, the S&P 500, the Wilshire 3000, and the Russell 3000 all hit record highs. S&P 500 is up 20.22% year to date. Only the Russell 2000 isn’t at its record high.
Investors usually get squeamish when stocks are this high because they are biased to think stocks are overvalued. If you are a natural contrarian, you will feel negatively towards stocks at their record high. But often it is a good time to buy stocks.
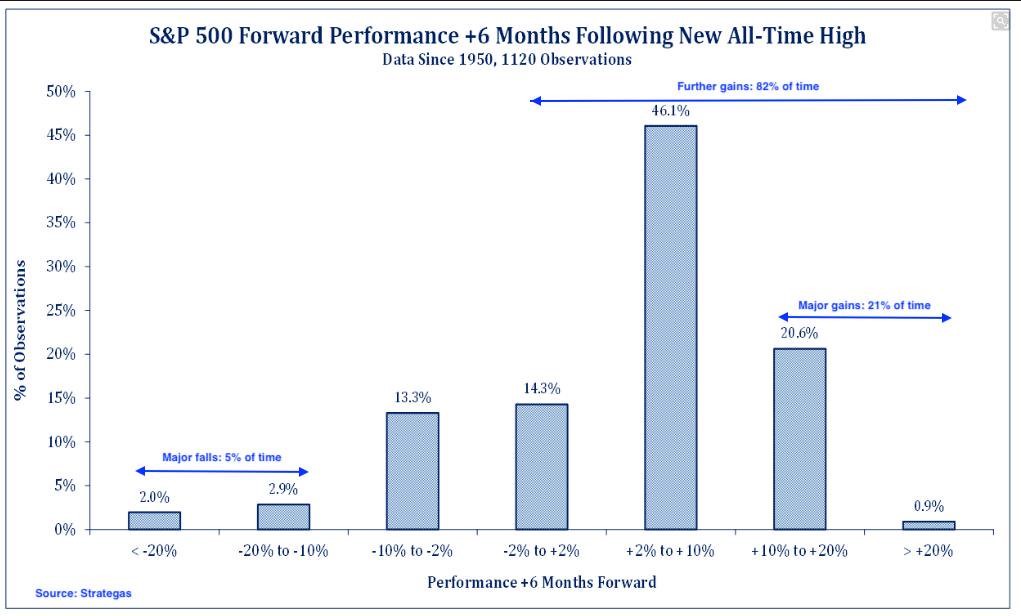
As you can see from the chart below, when stocks hit their record highs the S&P 500’s forward performance in the next 6 months is positive 82% of the time.
You need to find a catalyst for the economy to weaken. Or proof that stocks are very expensive to justify selling at a record high just like you would at any other moment. There are major gains of above 10%, 21% of the time dating back to 1950.
Another New Record High - Greed Is Back
That chart aims to get rid of any bearish bias you might have because stocks are at a record. That’s not to say that I’m bullish. In the near term (the next month) I’m starting to lean towards the bearish side. I see a 5% correction coming this summer.
Stocks are overbought and greed is back. VIX fell 4.18% to 12.39 on Friday.
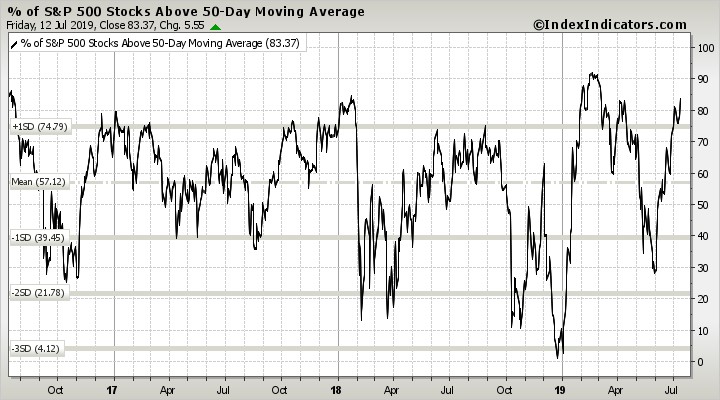
As you can see from the chart below, 83.37% of S&P 500 stocks are above their 50 day moving average. The highest point in the past 2 years was this February when it went above 90%.
Keep in mind, the percentage was near where it’s at now in January 2018 which was the investor sentiment peak of this cycle. By some metrics sentiment hit multi decade highs back then.
We aren’t there now, but greed is here. CNN fear and greed index increased 2 points to 64 which signals greed. It’s time to get bearish when this index gets above 75.
Specifics Of Friday’s Action
Another New Record High - All but 3 sectors rallied on Friday. The utilities, healthcare, and real estate fell 0.64%, 1.18%, and 0.39%. Best sectors were the industrials and consumer discretionary which were up 1.78% and 1.06%.
The ‘right’ stocks rallied in the sense that the cyclicals outperformed the defensive stocks. Utilities fell even though bond yields fell. 10 and 2 year yields fell 2 basis points to 2.12% and 1.85%.
That’s not much for the 10 year yield as it is still much higher than its trough earlier this month. There is a 22.5% chance of a 50 basis point cut on July 31st which isn’t enough to make me think there will be one.
First 22 S&P 500 Earnings Looking Good
Another New Record High - Financial websites need to get clicks at any cost. That means there are a lot of articles claiming the Q2 earnings season is about to be a disaster. The truth is it will be ok. It’s certainly not about to see amazing growth, but the comps are very tough.
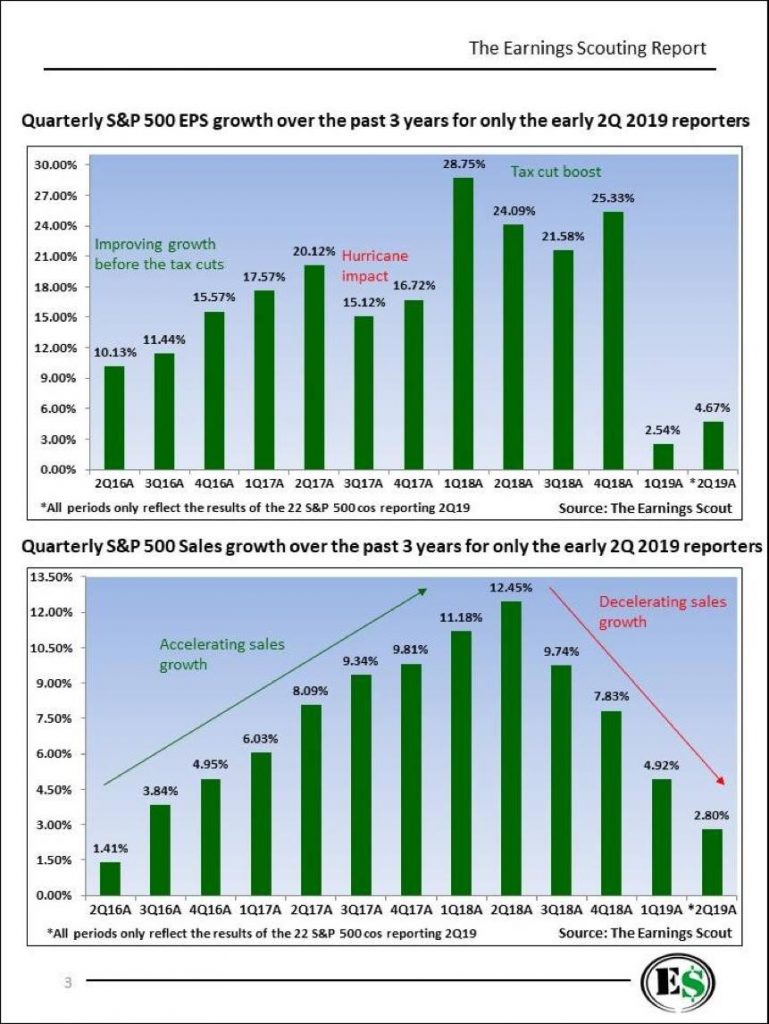
As you can see from the top chart below, with the first 22 S&P 500 earnings reports in, earnings growth is 4.67%. That’s almost double the growth rate in Q1. Growth acceleration from the first 22 firms isn’t what you’d see in a disaster.
On the other hand, sales growth was the weakest since Q2 2016 as you can see from the chart below. It’s only slightly more than half the growth rate in Q1. This is the 4th straight quarter of weakening sales growth.
Let’s see if this trend continues in the next week as the major banks are about to report their results.
Another New Record High - FactSet Earnings Results
The section prior to this was data from The Earnings Scout. Now let’s look at what FactSet has to offer with its week 1 data. At the end of Q2, EPS growth was expected to be -2.7%. That's higher than last quarter. It started with estimates of -4%. Q1 ended the quarter with slightly negative growth.
Current estimates are for -3% Q2 growth. That will go up as companies release their results. Obviously, since these estimates are starting lower than The Earnings Scout’s data, they have a smaller chance of being positive.
FactSet reviewed the first 22 conference calls to figure out what is driving weakness.
FX/currency was mentioned as a negative impact the most as 12 companies mentioned it. 13 mentioned it last quarter. Tariffs/trade was mentioned on 8 calls which is more than the 6 mentions last quarter.
That makes sense because new tariffs were added. Wage and labor costs were mentioned on only 7 calls which is down from 10 calls in Q1. That’s in tune with the decline in hourly wage growth.
Finally, raw materials and other inflation was mentioned 7 times which was down from 9. Inflation has been declining, so that makes sense.
Another New Record High - Conclusion
The stock market is at its record high. That’s not a bearish sign in itself. It’s actually a pretty good sign.
However, the increase in greed and the overbought nature of the stock market makes me lean towards expecting a correction soon.
Even though GDP growth is expected to be below trend in Q2, EPS growth is actually higher than Q1 based on the first 22 firms’ results. Before you ignore these results, they actually have a pretty good track record at signaling how the quarter will turn out.
We will see if they are accurate next week when the major banks report earnings.