Apple Sells Off
The stock market ended Friday mixed as the Nasdaq was the biggest sore spot, falling 0.59%. As I highlighted in previous articles, Apple usually falls right before the unveiling of its new phone. The 1.63% decline on Friday added to the Nasdaq’s woes. The stock is now down 3.30% off its all-time closing high. It will likely drag the market lower early next week. The biggest uncertainty for the September 12th release will be the pricing of the new devices. There is expected to be 3 new devices unveiled with the high-end device potentially costing $1,000+. Apple has been great at getting customers to pay more money for smartphones with better features. The question will be if that finesse will be able to be repeated. The number of new devices for sale has diminishing returns. The question is how many buyers will switch from the Plus version of the devices to the new higher end. Samsung has done this by offering the Note 8 which is over $900. That costs about $300 more than the Galaxy S8 and the Galaxy S8 Plus. The extra features in the Note 8 are the S pen and the extra camera lens which allows for portrait pictures. If Apple can future differentiate the high-end device, it will generate additional profits. If it can’t, the new device could be a flop. While Apple has a great track record, it faces the same risk Samsung has seen. Many tech reviewers are saying it’s better to go with the Galaxy than the Note because the premium price isn’t worth it.
Debt Ceiling Raised
The big news on Friday was that the government raised the debt ceiling for 3 months and voted for $15 billion in disaster relief for hurricane Harvey and Irma victims. The vote in the House was 316-90 with all the no votes coming from Republicans. This is what was expected as the President decided to work with the Democrats instead of the Freedom Caucus. I think a big reason for this was FEMA running out of money. I would have been a big PR blunder for the President to try to eke out small spending cuts at the risk of not getting the people in Florida and Texas the relief they need. There’s a possibility more money for disaster relief will be on the table when the December deadline comes about, but it won’t be of dire need which means I don’t think it will be so easy to get the debt ceiling permanently rescinded by using hurricane relief as an add-on. We will revisit this topic in about 2 months when the discussions heat up.
Relative Valuations
One of the most common arguments against U.S. stocks is that there is a larger than usual valuation gap between global stocks and American stocks. However, the reasons for this gap are that the U.S. is more technology focused which is a sector which has higher growth and the subindustries are more promisingly weighted in the U.S. The U.S. has more firms in online retail and industrial chemicals which are better businesses than autos and mining which are the prominent sectors outside America. These explanations aren’t meant to say why American stocks will outperform; they’re meant to explain why American stocks possibly underperforming isn’t clear cut. Whenever you hear an explanation which gives you a simple clear cut answer, you need to examine the evidence further. It’s valuable to know relative PEs, but that’s a starting point for further research. Every market is priced the way it is for a reason. That doesn’t mean you can’t find opportunities, but the first step to finding a mispriced asset is understanding why it’s at that price to begin with.
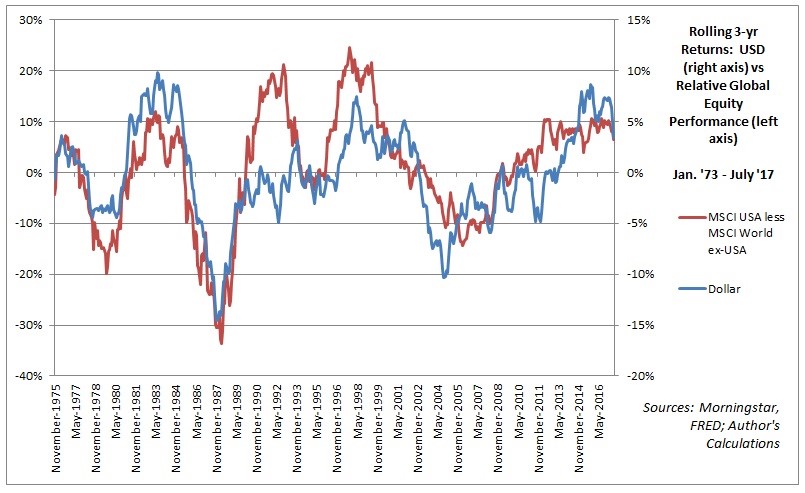
One of the metrics which will affect how well the American market does compared to the rest of the world is the dollar. As you can see in the chart below, the dollar has a 70% correlation with this outperformance. With the dollar at a 32-month low and looking weaker by the day, this doesn’t look good for America’s relative performance. The obvious question is whether this bear market in the dollar will continue. It’s been Trump’s goal to weaken the dollar which has been successful. Hopefully for the U.S. market’s sake he gets his other goals done which are tax cuts and infrastructure spending.
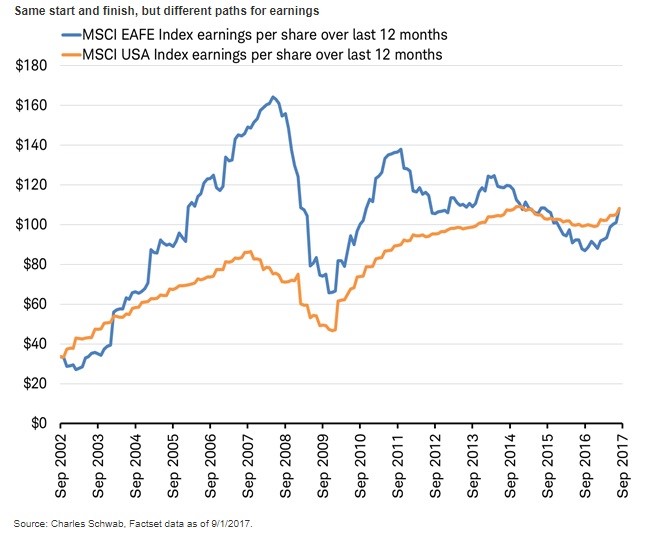
The chart below compares American earnings to the earnings of developed markets outside of America and Canada. As you can see, the developed earnings have been much more volatile recently as the earnings started at a higher peak in 2014 and fell to a lower trough in 2016. It makes it look like the economy went even closer to a recession overseas than here. Earnings are now at the same level as America. America is at a record high and developed markets are well off their 2007 high.
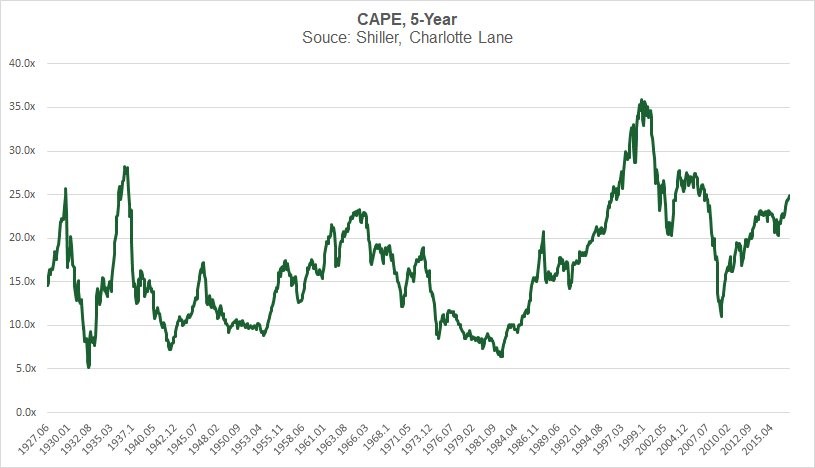
One of the new arguments against the Shiller PE is that it uses the 10 year earnings. 10 year earnings include the collapse in 2008 and 2009, so the bullish argument concludes that once we get to 2020 in about 2 years the earnings rebound will push the Shiller PE lower. We don’t need to wait until 2020 to see that effect on the Shiller PE because we have the 5 year Shiller PE in the chart below. As you can see, the valuations look different, but it’s still very high. The chart makes the 1990s peak lower and other peaks higher. We are a couple points off the peak before the 2008 crisis. The chart is just an example to prove the theory which says that the market is cheaper than it looks because of the weak 2008 earnings wrong. The 10 year Shiller PE is still superior because it is the proper cyclical adjustment. Business cycles don’t last 5 years; they get closer to 10 years. There’s almost always a recession included in every 10-year period, so 2008 isn’t unique in that regard. The one part which is unique in is that was the only period where S& 500 earnings went negative. Just to be clear, if earnings were to grow at a similar rate and stocks were to rise at a similar rate, the Shiller PE would be relatively high in 2020. This isn’t a prediction; it’s an inference. If stocks fall or there’s a recession, the results will be different.