Clearly, the results of the UK referendum leave us with quite a bit to think about going forward.
Trading in the days ahead of the vote provided some important lessons in investor psychology and we learned, yet again, that the post crisis landscape is vulnerable to tail events. We were also reminded of the extent to which the world is becoming increasingly polarized as political tensions continue to dominate the macro picture.
While it’s undoubtedly important to take a step back and assess things from a kind of philosophical, 30,000 foot perspective, we also need to be practical and pragmatic. And that means making some educated guesses about the implications of what just happened for US corporates and thus, for US equities.
Earlier this week, we took a look at which S&P companies are most exposed to the UK from a revenue perspective. Now that the broad dollar looks set to strengthen in Brexit's wake, let's consider what this means for US multinationals.

Before we take a closer look at which US companies are set to get hurt the most from a prolonged bout of dollar strength, let’s zoom out so we can get some context on what’s happened this year:
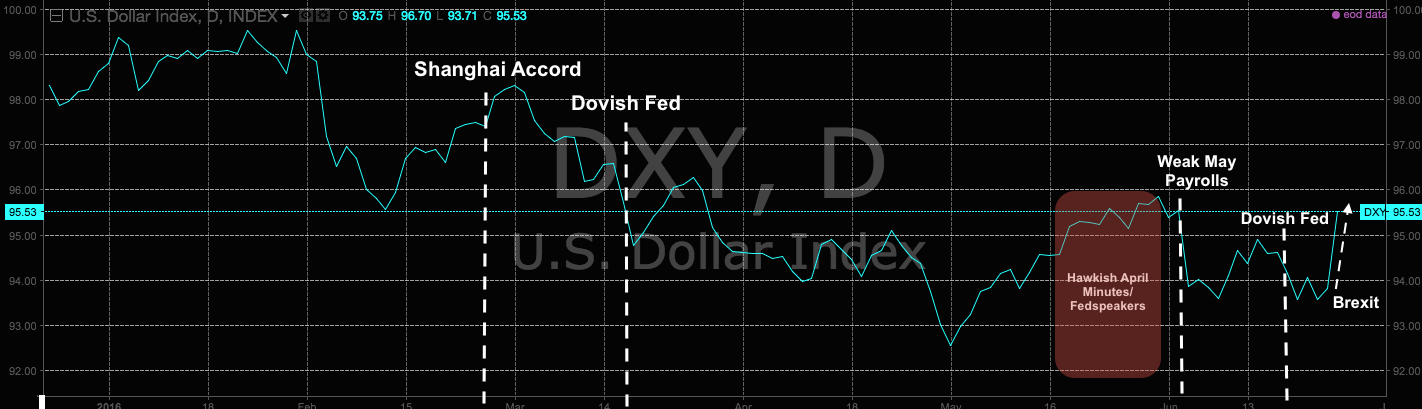
So essentially, the story is this: following a horrific January for risk assets, the world wasn’t ready for a stronger dollar and so at the G20 meeting in February, a weak dollar regime was agreed. The Fed promptly leaned dovish in March reinforcing a weaker USD. Risk rallied. The release of hawkish Minutes from the April meeting and a flurry of hawkish rhetoric from Fed officials in May was meant to prepare the market for a June hike. The weak May jobs print took that off the table. Brexit rolled around and now July (and probably September) are out as well.
But here’s what you have to understand: this is set against a backdrop of more easing ahead by the BoJ and the ECB and now probably the Bank of England as well. In other words, unless the Fed actually moves to cut rates, and unless risk-on sentiment suddenly makes a comeback, the dollar will likely be pressured higher.
Ok, so who should we worry about? Well, large caps, first of all:

(Chart: Credit Suisse)
As you can see there’s a pretty clear negative correlation between downward earnings revisions by large cap companies and USD strength.
Let’s get more granular. “Capital Goods, Materials, and Household & Personal Products have shown the strongest inverse correlations between earnings revisions and yr/yr Dollar moves, with revisions surging on 1H Dollar weakness,” Credit Suisse notes, adding that “if the Dollar strengthens, these groups could be especially at risk to a reversal of improving revisions trends.”


(Charts: Credit Suisse)
Ok, got it. So is there any way to quantify this in an easy to understand fashion? Yes, there is and fortunately, FactSet has endeavored to do just that. Here are some excerpts from their most recent analysis of Q2 earnings season:
“Coming into the start of the Q2 earnings season, there are concerns in the market about the impact of the stronger U.S. dollar (relative to last year) and the impact of lower global economic growth on the sales and earnings of companies in the S&P 500. Based on estimates as of today, are companies in the S&P 500 with more global exposure expected to report weaker sales and earnings growth relative to companies in the index with less global exposure for the quarter?
“The answer is yes. FactSet Geographic Revenue Exposure data (based on the most recently reported fiscal year data for each company in the index) can be used to analyze global sales exposure for all the companies in the S&P 500. For this particular analysis, the index was divided into two groups: companies that generate more than 50% of sales inside the U.S. (less global exposure) and companies that generate less than 50% of sales inside the U.S. (more global exposure). Aggregate earnings and revenue growth rates were then calculated based on these two groups.”

(Chart: FactSet)
So there you have it. There’s an enormous disparity here and you can expect the impact of this dynamic to be magnified to the extent BoJ, ECB, and BoE policy (i.e. ease) continues to diverge from Fed policy (i.e. hold and eventually hike).
Trade accordingly.
1 Comment
Marshall
June 28, 2016So, Don, for those of us who trade at a slower rate, would this chart (predicting about 10% reduction in earnings and revenue growth) encourage us to sell the s&p short at these levels and hold the short for a couple months to see what happens?? I am guessing that a shortfall in profits will result in lower share prices.