Review Of The Fund Manager Survey
It's useful to check the Bank of America fund manager survey to see where money managers are positioned. The great thing about the fund managers survey is it provides depth to your understanding of the market because fund managers often have the opposite opinion of the market. You can either fade their positioning or follow their opinion.
What I find works best is to formulate an opinion on asset classes before checking what the market thinks. This is similar to how Warren Buffett looks at a firm’s financials before checking the price of the stock. If the stock price is less than his estimated valuation, he buys. If it’s higher, he waits. Similarly, review the fundamentals that drive sectors before looking at surveys and the recent price action. My biggest mistakes have come from simply going against the status quo. Just because a trend is in place doesn’t mean you should fade it. I wasn’t necessarily trying to fight the market, but my stance was influenced by the price action. When you start with analysis, you only swing at the pitches that are hit-table. You only buy the assets that you like which are falling and vice versa for shorting.
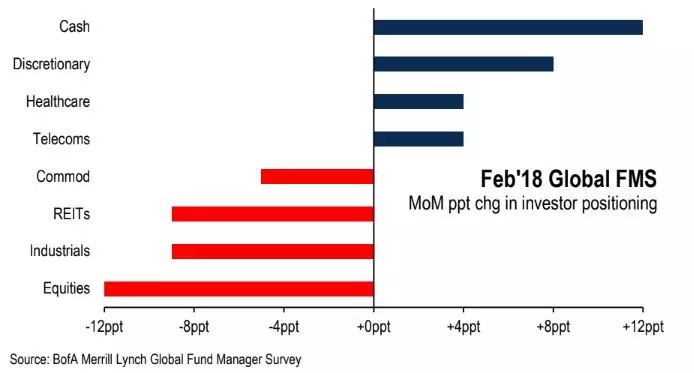
The first chart shows the month over month positioning in a few assets. As you can see, the cash positioning has increased by 12%. This survey took place during the panic selling which is great because it shows you the psychology of the managers at the height of the storm. This cash change is a big reversal from the record low cash positioning in January. Equities lost 12% which means managers went from equities to cash. The timing of the selling determines which managers had a good week. Some started selling at the peak and some sold at the trough. Mistiming the selling by a few days can hurt a manager’s performance for the year. The selling in commodities is interesting because some fear heightened inflation will cause the Fed to raise rates. The Bloomberg Commodities ETF fell from $200.52 on January 26th to $188.51 on February 9th. This was partially driven by the selling in oil which I discussed in a previous post.
Monetary Policy Conundrum: Real Yields Increasing
Many investors and analysts were worried in January about the potential scenario where the Fed wouldn’t have much room to cut rates in the next recession. This wasn’t being priced in stocks because it’s only a potential problem. However, these investors would be selling hand over fist if they saw a recession coming down the pike in early 2019 with rates only at 2.25%. The Fed would hit the zero bound after cutting rates about half the amount they normally do when the economy is in a recession.
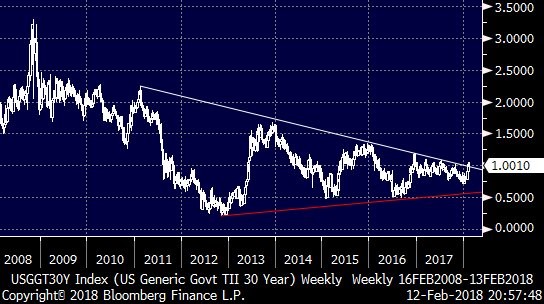
The interesting facet of this line of thinking is investors sold stocks when the term structure increased because of the fiscal stimulus even though that could solve the Fed’s problem of being too close to the zero bound. During the stock correction, inflation expectations fell. As you can see from the chart below, real yields have been increasing. The 7 year trend line has been broken, just like how the trend line in the nominal 10 year bond yield has been broken.
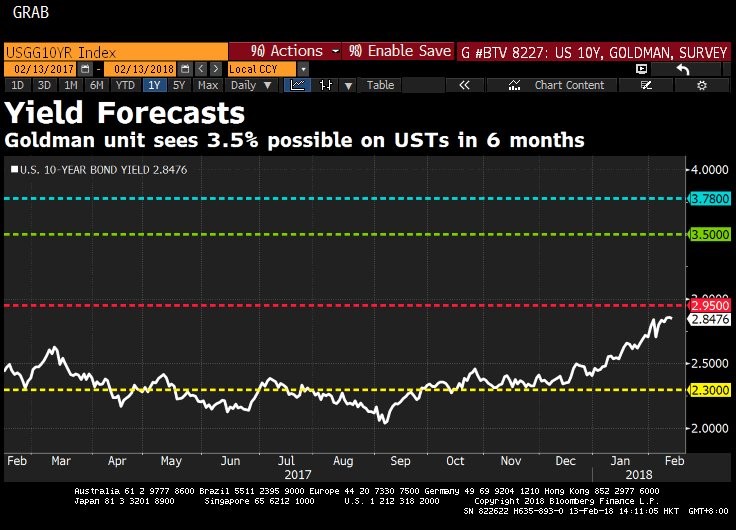
The chart below shows the 10 year bond yield along with some 6 month forecasts. The blue line is the top end of the Bloomberg survey. The green line is Goldman’s forecast. Goldman is way above the median which is the red line. The yellow line is the bottom end of the survey. The median forecast isn’t scary since is about 10 basis points from where we’re at. The Goldman forecast probably worries many investors because I mentioned that 3.5% is where yields will hurt stocks. However, the improvement in the Fed’s standing because of the increasing term structure, makes increasing yields a long term positive. The Fed will have room to hike rates during the next recession. I think we’ll see stock prices go up less than earnings in 2018. We’ll see multiple compression while stocks rise modestly. Rising real yields hurts valuations, but it’s a positive because it means economic growth is improving. I don’t see a bear market until inflation increases rapidly or there’s a recession. Neither of those catalysts will occur in 2018.
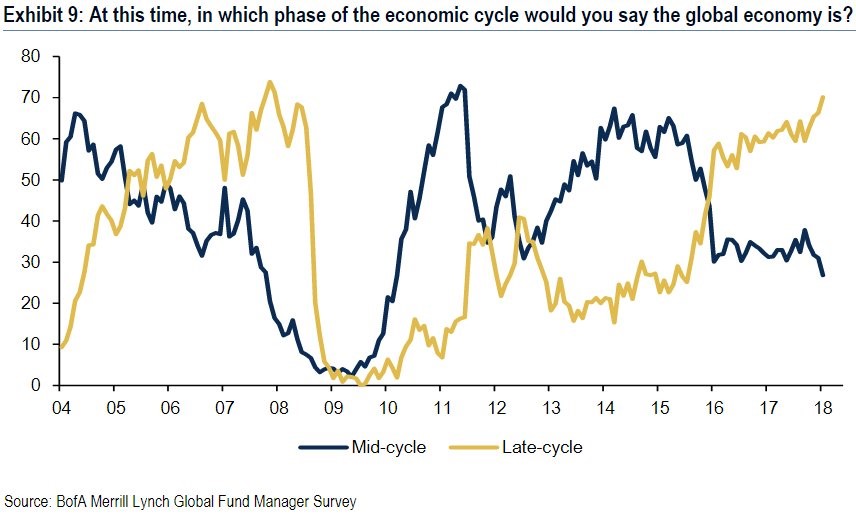
Merrill Survey- Economic Cycle
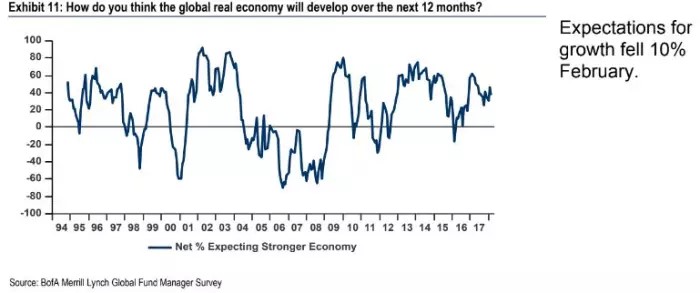
Speaking of the business cycle, the Merrill surveys show where fund managers think the economy is and if it will accelerate in the next 12 months. As you can see from the chart below, the net percentage expecting the economy to accelerate in February fell by 10%. That’s not a surprise because stocks were falling and investors were panicking. Real yields tell us economic growth will improve in the next 12 months. I think this survey would be in a better state if it was asked this week instead of during the correction. Keep in mind, I’m only disagreeing with the 10% who changed their mind. Most managers agree the fundamentals of the economy are still strong in the intermediate term.
The chart below gets into more detail where fund managers think the economy is in the cycle. As you can see, 70% think it’s late cycle. Normally, I’d expect a recession very soon, but the tax cut delays the inevitable by a couple years. We’ve stayed in the late cycle phase since 2016 and I expect that continue for another 1-2 years. In the last cycle, the survey hit about 70% in late 2006. That was about one year before the recession. This cycle is different because the U.S. economy has the benefit of a tax cut and the re-acceleration of global growth driven by emerging markets.
It’s easy to look at this situation after the correction in stocks and predict a bear market, but investors need to stop worrying about the economy 2 years from now, which is an uncertain prediction, and focus on the current economy. Unless it falls off a cliff in the next couple months, the correction won’t become a bear market.