50 Day Moving Average - Just Missed Record High
The S&P 500 just missed setting a new record high in the week shortened by Good Friday. On Thursday it increased 16 basis points to 2,905.03 which is about 2 points below its high for the year and 25 points below its record closing high.
Nasdaq increased 2 basis points and Russell 2000 fell 12 basis points. VIX fell 4.05% to 12.09 which is signals complacency. It can easily spike higher this month. Even with this decline in the VIX and modest rally in stocks, the CNN fear and greed index fell 1 point to 70.
Make no mistake about it, the market is very overbought. The S&P 500 has increased 13 of the past 16 days.
50 Day Moving Average - Young Bull Market?
If you ignore the times the stock market fell by slightly more than 20% and say the bull run started at the bottom in March 2009, this is the longest bull run in history. It is 121 months old now and shows no signs of stopping. The 1990s bull run was 113 months. This expansion is about to be longer than that one as well.
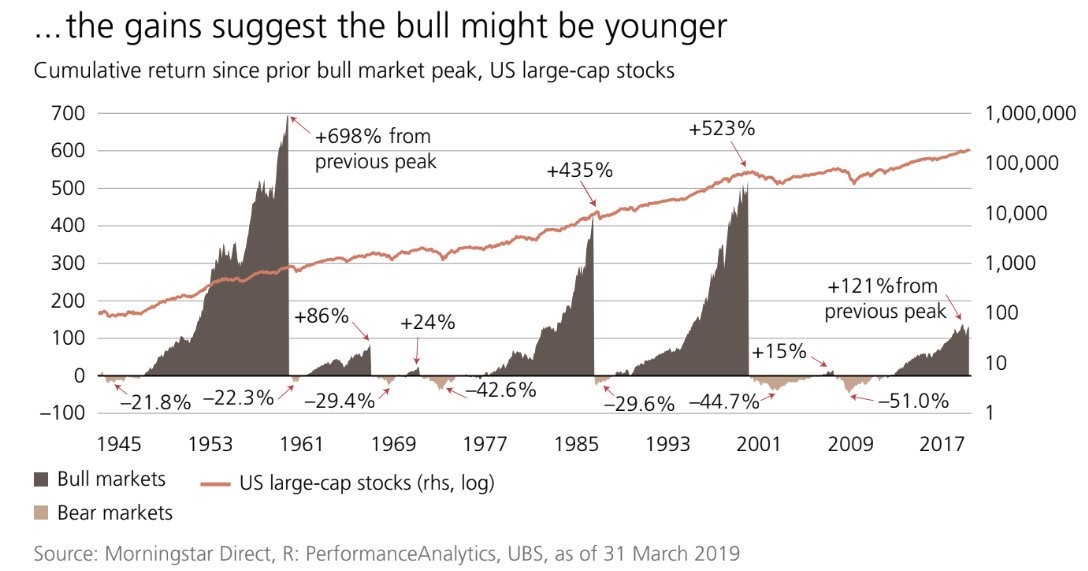
There are various definitions of bull markets. If you look at the gains from the previous cycle top, this has been a relatively weak one.
As you can see from the chart below, the S&P 500 is only up 121% from its previous peak. That’s because the bear market from 2007-2009 was the worst since the Great Depression.
Since the 1940s, there have been 3 bigger bull markets as the market increased an astounding 698% from its previous peak in the 1950s. It seems highly unlikely that this run will surpass the top 3 in this chart, but it gives context as to the potential headroom of this market.

50 Day Moving Average - Sector Analysis
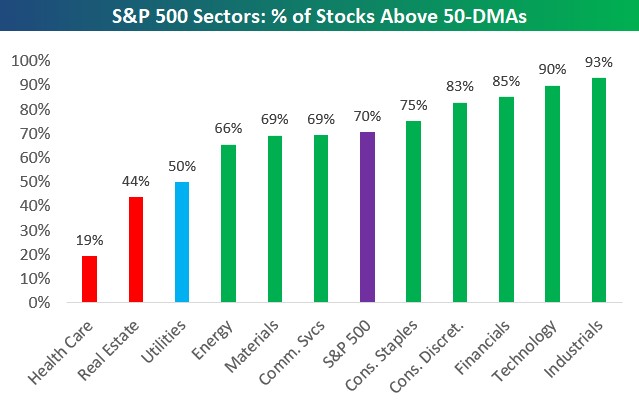
Every sector is overbought except the utilities, real estate, and healthcare. As you can see from the chart below, 70% of S&P 500 stocks are above their 50 day moving average. Only 19% of healthcare stocks are above their 50 day moving average as this sector is terribly oversold.
Industrials and technology are wildly overbought as 93% and 90% of their stocks are above their 50 day moving average. Technology and the industrials kept rallying on Thursday, and healthcare didn’t selloff.
The 2 worst sectors were energy and the financials as they fell 0.53% and 0.24%. Financials were hurt by falling yields as the 10 year yield declined 3 basis points to 2.56% and the 2 year yield fell 1 basis point to 2.39%. A difference between the two is 17 basis points which is nothing to worry about in terms of an inversion signaling a potential recession.
The 2 best sectors were the industrials and real estate which increased 1.11% and 0.75%. Even though the March industrial production report was weak, industrial stocks smell a global economic recovery led by manufacturing as China is turning around and a trade deal is about to be made.
50 Day Moving Average - Very Good Earnings Season Continues
The big internet firms are all reporting earnings in the next couple of weeks. Alphabet reports on April 29th, Apple reports on April 30th, Facebook reports on April 24th, Amazon reports on April 25th, and Microsoft will report on April 24th. 3 of these 6 firms are reporting this coming week.
In the past 2 days after reporting a sold quarter, Netflix stock is up 0.25%. I’m very interested in seeing how firms’ stocks react to their earnings because most are overbought. I get nervous if I own a stock that has soared heading into its earnings report. One weak number can send it down double digits.
As you can see from the table below, which has updated earnings results as of April 18th, the first 77 S&P 500 firms had a solid quarter. My concerns about earnings estimates crashing in the first 2 months of the year were overdone because they shouldn’t have fallen that much.
Companies gave guidance that was too negative last quarter. EPS growth has been 5.6% and the average surprise has been 6.07%. The average surprise is 2.03% above the 3 year average. FactSet shows blended EPS growth is -3.9%. Blended revenue growth is 5%. The table shows 55% of firms have beaten sales estimates which is 13% below the 3 year average.

50 Day Moving Average - Latest IPOs
Lyft’s initial trading after its IPO has been terrible as it is down 25.46% from its first close. Pinterest and Zoom did their IPOs on Thursday as they hope for a better fate. Pinterest stock increased 28.42% from its IPO price to $24.40. I think it could make sense to look at buying Pinterest after the company reports a few times and its stock slides a bit. I feel it can monetize much better than Snapchat and Twitter. It’s more of a commerce platform than a social media website.
Zoom is a video conferencing company. It had an even better first day of trading than Pinterest as it increased 72%. Investors love the firm’s growth as its revenues increased 118% in fiscal 2019. Gross profit increased 123%. The firm’s conferencing is user friendly and more customizable than Skype. It excels at facilitating interactions between presenters and participants.
One key feature is virtual hand raising. Zoom’s great features and customer support allow it to charge a premium price. If you’re wondering, I think there’s no chance Microsoft buys this firm because it would be cheaper to invest more in Skype, potentially copying some of Zoom’s features.
50 Day Moving Average - Conclusion
The stock market is very overbought. Investors are all in on the concept that the economy will turn around in the next few months. While agree with that narrative, I’m not willing to be bullish at these levels.
Next 2 weeks will be a big test for stocks as the bulk of earnings season is coming. If most of the big internet firms beat estimates, I expect the S&P 500 to reach a new record high.