Atlanta Fed Model Shifts Down Slightly
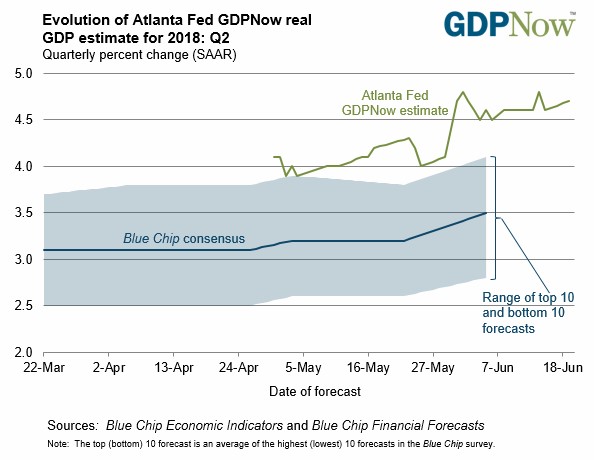
I was expecting a big drop of about three tenths in the Atlanta Fed Nowcast after the weak industrial production report. However, as you can see in the chart below, it only fell one tenth to 4.7% because other changes were positive. The industrial production report caused the estimate for real gross private domestic investment to fall from 10.9% to 9.2%. The real consumer spending growth estimate increased from 3.6% to 3.7%.
The preliminary June University of Michigan consumer sentiment report showed the index increased from 98 to 99.3, beating the consensus by 0.8. Consumer sentiment was higher in March even though consumer spending growth was just 1% in Q1, proving that small changes in consumer sentiment don’t mean the consumer will boost spending. Also, it’s interesting to see the decline in stocks in February and March didn’t hurt sentiment and the recent rally hasn’t helped it.
Even though these points are all true, I don’t want to see sentiment dropping as it implies weakness in the labor market or consumers’ ability to service their debt. The weekly Bloomberg consumer confidence report also showed strength as it increased from 54.8 to 55.8 which was its best report in one month.
Strong Housing Starts
When I set my expectation for the Atlanta Fed Nowcast, it was before the housing starts report. The upside surprise in that report pushed up the estimate for real residential investment growth from 0.3% to 2.9%. That’s a big boost as last month’s housing starts were lower. As you can see from the chart below, the seasonally adjusted annual rate of starts went from 1.286 million in April to 1.35 million in May which is 5% growth. That beat estimates for 1.32 million and was at the high end of the consensus range. The permit level was 1.301 million which was below the consensus for 1.35 million, below the low end of the consensus range, and lower than last month’s report of 1.364 million. That’s a 4.6% decline.
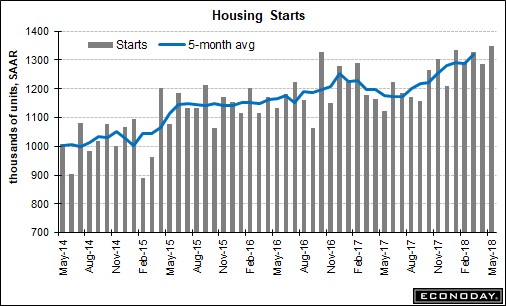
To be clear, a housing start is when the construction for a new building primarily for residential purposes begins. The beginning of construction is when the foundation of the building is excavated. Starts occur after the permit process, so the weakness in permits reflects future construction and the strength in starts reflects the strength in current construction.
The weakness in permits on a SAAR basis was mostly in multi-family homes as permits were down 8.8% to a 457,000 rate; single family permits are down 2.2% to an 844,000 rate. I have discussed in previous articles how the zoning restrictions are causing housing prices to soar in cities such as Seattle. This could be a part of the constraint, but it’s only month over month weakness, meaning the permits aren’t in decline. To be clear, we would rather have people be able to afford a single family house, but it’s better to have an affordable apartment, than no place to live.
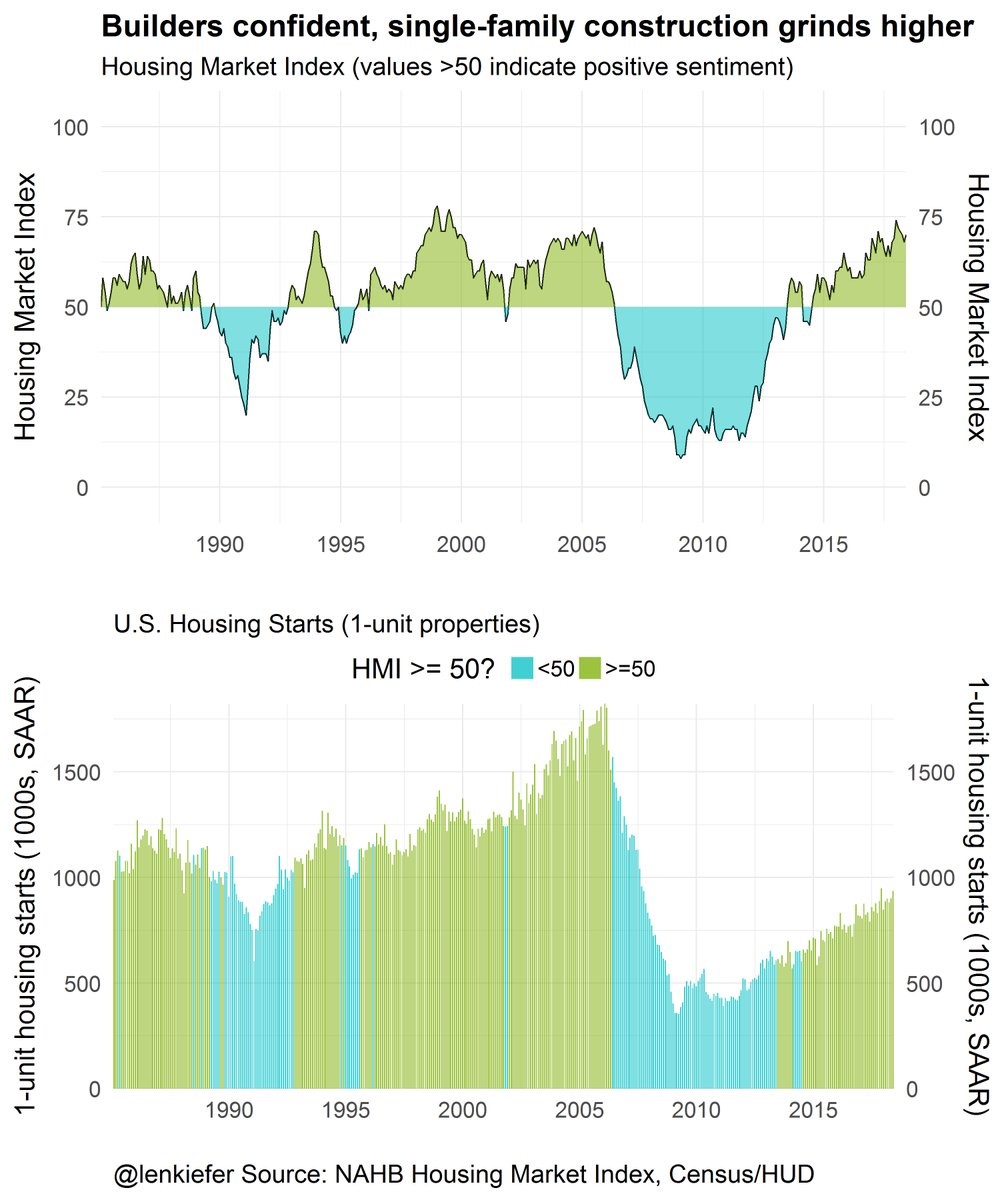
The top chart above shows the housing market index which measures builders’ confidence. It’s important to point out that this positive cycle is much shorter than the overall economic expansion because builders were extremely negative a few years after the recession ended. That’s good news for the current cycle. The last cycle was the opposite as the confidence barely went negative during the 2001 recession. There was a long string of positivity from the 1990s to the 2000s. If there is a recession in 2019, there won’t be close to the blowup in housing that there was in 2008. It was likely a once in a generation event.
The 2nd chart shows the housing starts for single family housing. There has been a housing shortage for a few years as the market over corrected. The rate from 2000 to 2005 was too high, causing a big glut. The rate since 2009 until now has been too low. The starts are still lower than the mid-1990s when there were much less people in the country. In 1995, there were 266.3 million people in America and now there are 325.7 million. The good news is if the starts recover in the next few years, there will be a long runway of growth to help the real residential investment portion of GDP.
As I mentioned, the starts part of this housing report was much better than permits. Single family housing starts were up 3.9% to 936,000; multi-family housing was up 7.5% to 414,000. Completions are the final part of the process. You can think of permits as the future, starts as the present, and completions as the past. Single family housing completions were up 11% to 890,000, while multi-family housing completions were down 13.8%.
Finally, looking at the year over year growth rates, permits were up 8%, starts were up 20.3%, and completions were up 10.4%. As you can see, the current building growth is better than the past and the future. This explains why construction job growth has been so strong. The May ADP report showed 39,000 construction jobs were added, making it the 2nd largest subcategory.
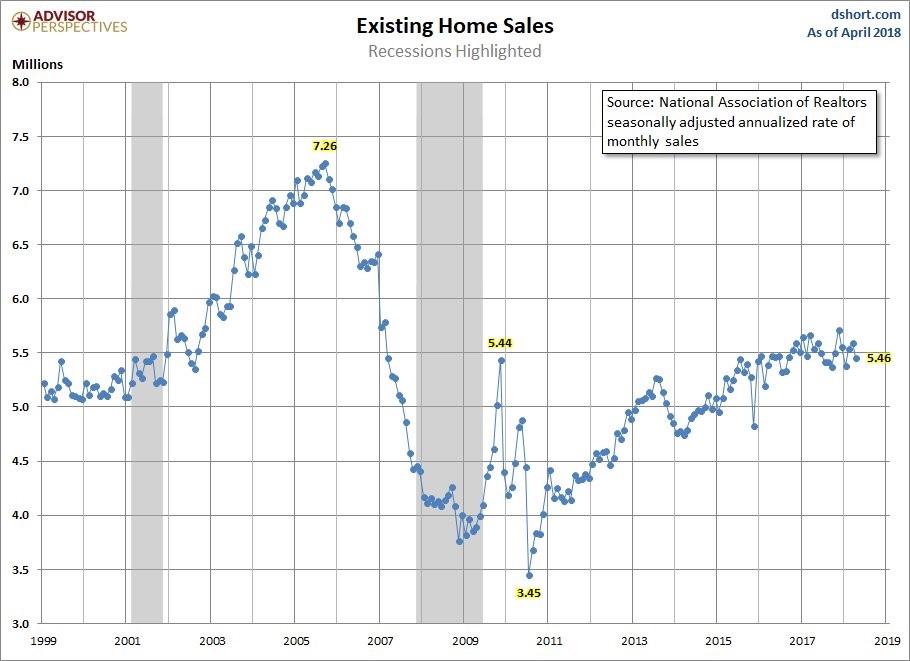
New home sales, which are a leading indicator of economic growth, have been incredibly strong as they are up in the low single digits. The existing home sales have been flat this year as the April report showed a 1.4% year over year decline. As you can see in the chart below, this is a larger market than new homes sales and it has already recovered more than new home sales. The May report will be released Wednesday.
Conclusion
The manufacturing portion of industrial production was weak in the May report, but that isn’t stopping a great Q2 GDP growth print. The NY Fed model has been pessimistic this quarter. The industrial production’s effect on its model was greater than other models. The CNBC GDP tracker shows there was no effect on Q2 growth from this report. The latest estimate is an average of 3.9% growth from 11 models. The median is 3.7% growth. I reviewed the housing market in this article, showing you how strong starts are. That’s good news as the housing market has fully recovered from the 2008 crisis and has been able to withstand rising mortgage rates.