Further Decline In Initial Jobless Claims
Thursday has meant doom for the economy as the number of initial claims builds to epic proportions. It’s likely the unemployment rate is in the high teens based on the latest data from initial claims. We have seen stocks rally on these terrible initial claims reports which is probably because of 2 reasons. First is stocks were oversold in late March. They were bound to rally regardless of the data.
When the S&P 500 was down 34%, it had already priced in the worst case scenario. When stocks were that low, they were pricing in an elongated recession which meant bad news didn’t phase them. Secondly, high claims are good for returns because they mean a bad decline has occurred and new runway for an expansion has been created. Think of this like an hour glass being turned over. Historical trends were correct as the stock market did decline in anticipation of the weakness.
Thursday would have been yet another example of a rally on bad news except the WHO came out with some disappointing news on the potential coronavirus drug remdesivir. Gilead disputed those results from China saying the study was terminated early. Considering the fact that the stock market rallied on hope based on little data on the drug’s effectiveness, it’s not surprising it sold off on bad news on the drug even if the news is inconclusive.
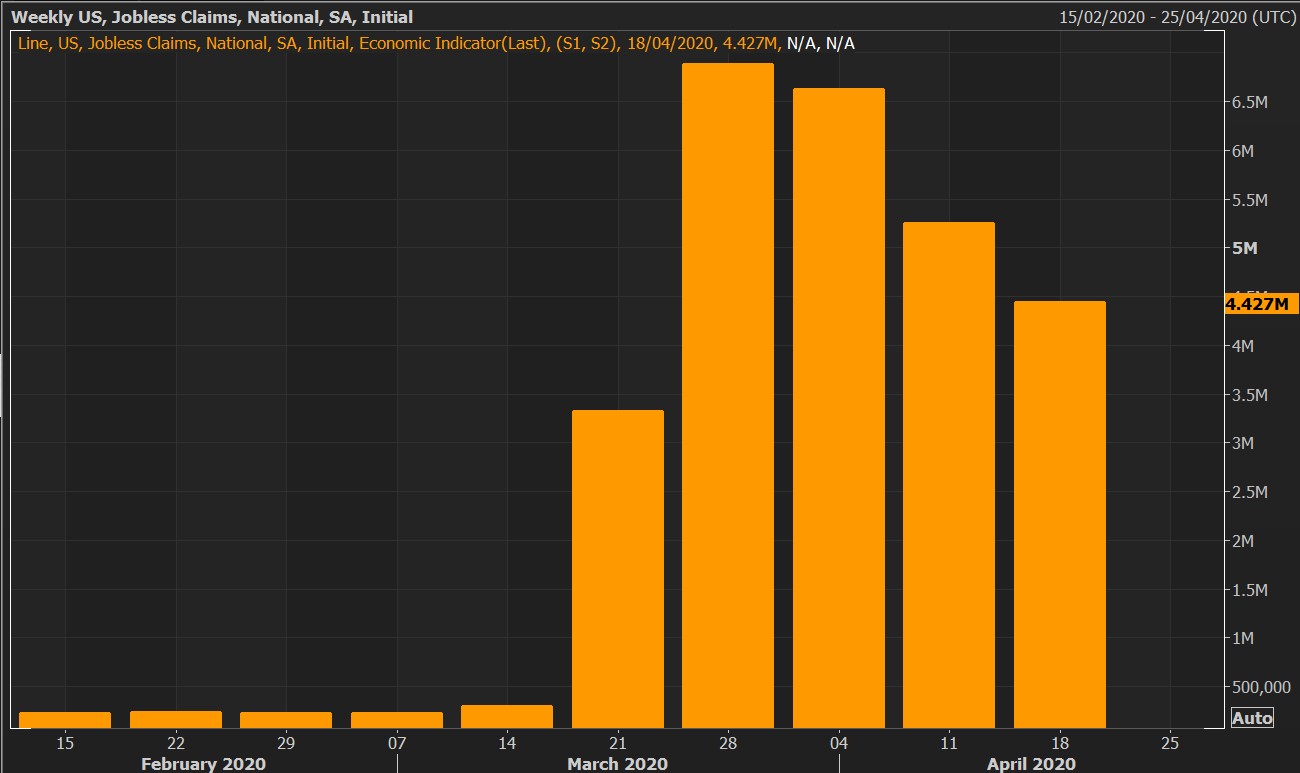
Predicitions that initial claims made their peak in March look very obvious now as they continued to fall in the week of April 18th. It's not a brilliant prediction because it was literally impossible for claims to stay above 6 million for much longer than they did.
People probably disagreed with because they were fearful and everything was uncertain. However, math doesn’t have emotions. Specifically, in the prior week claims were revised down slightly from 5.245 million to 5.237 million. It’s a positive we finally aren’t seeing revisions which show many more claims.
Bad news is claims were worse than estimates as economists weren’t too bearish again. There were 4.427 million initial claims in the week of April 18th which was above estimates for 4.25 million.

As you can see from the chart above, this was the 3rd week in a row claims fell. On the other hand, continuing claims increased from 11.912 million to 15.976 million. That’s way above the previous cycle high of 6.635 million. We have almost double the claims as the last recession which means we will have almost double the unemployment rate.
Next week’s unemployment report from April will show the unemployment rate is somewhere between 13% and 15%, but the true rate including this data is closer to 20%. May report will probably show the unemployment rate is in the mid to high teens.
People Are Saving The $1,200 Check
The chart below is a UBS survey which asks consumers what they will do with the $1,200 government check. As you can see, over 30% said they would save the money. On the one hand, the fact that these people would save it implies they don’t need it right away for necessities. On the other hand, saving more might be the new motto for the consumer which is bad news for the economy.
People will likely bulk up their savings this year even after the shutdowns end because of the uncertainty. Just like how the stock market doesn’t like uncertainty, neither do consumers. While the stock market thinks it has its arms around the COVID-19 crisis, it still doesn’t have its arms around the economic crisis.
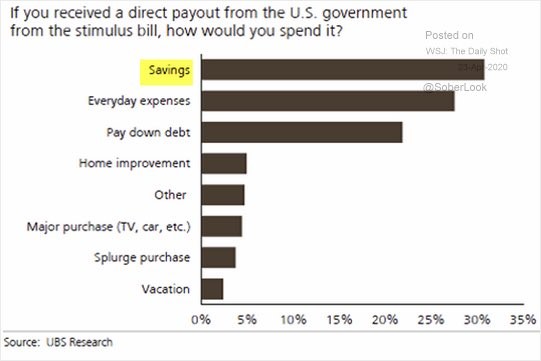
The survey also shows slightly less than 30% of consumers would spend the money on everyday expenses. These were the people who didn’t have enough savings to deal with job losses. Specifically, heading into this crisis, 53% of households didn’t have emergency savings. 59% of those ages 18-29 and those ages 40-49 didn’t have emergency savings.
Honestly, it's shocking that anyone would spend the money on a splurge or a vacation. Clearly, they are in the minority.
Downgrades Everywhere
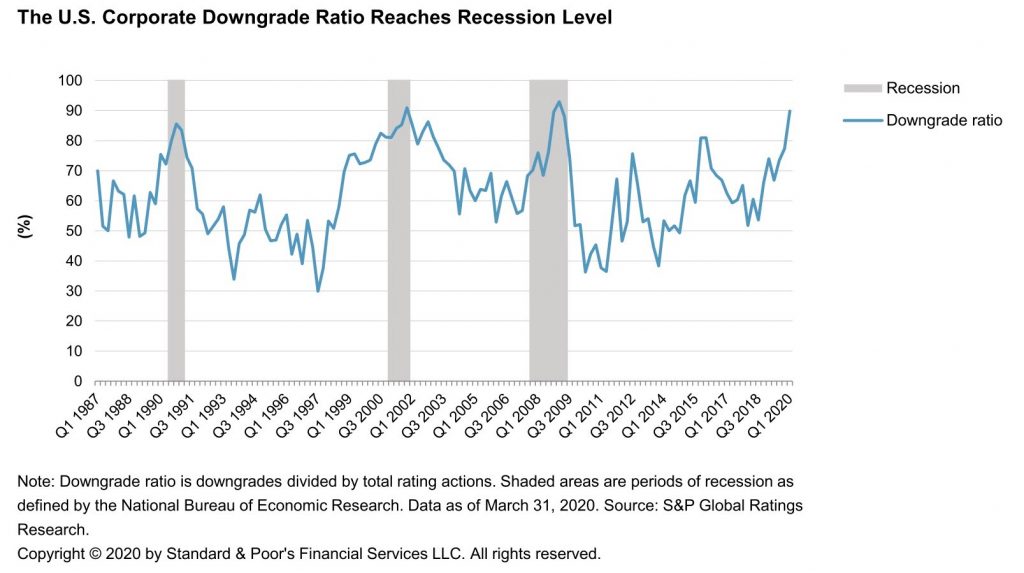
As you can see from the chart below, the downgrade ratio is already near the last 2 recessionary peaks and is worse than the early 1990s recession peak. We are starting to see some companies raising debt to paydown their revolvers they took out. It’s better to issue debt to maintain flexibility. 10 day rolling sum of companies doing this is about $7 billion. More stability there is in the financial markets, the more likely there will be more debt issuances.
A most egregious issuance is by Macy’s who wants to raise $5 billion and use inventory as collateral. Personally, I think Macy’s will survive this downturn, but it won’t last much longer. It will fail within a few years. Even with the great consumer last holiday season, the firm had negative same store sales growth. Imagine how weak the numbers will be this holiday season.
Q1 Earnings Season Update
The table below shows the updated earnings scorecard as of Thursday morning. Q1 earnings season hasn’t been good, but it hasn’t been a disaster. Q2 results will be a disaster. Latest estimate is for a 25.78% decline. It would be shocking if that estimate doesn’t fall below -30% by the end of this earnings season.
As the table shows, there has only been an average EPS surprise of 0.73%. Analysts barely lowered their estimates enough for more than 50% of firms to beat them.

It’s no surprise this EPS surprise rate is way below the 3 year average which is 4.66%. We have updated results on Q1 based on the after hours reports on Thursday. 62% of 118 firms beat estimates on -13.29% growth. 66% beat sales estimates on 2.36% growth.
Now let’s just look at the firms with March in their Q1 to see the impact of the shutdown more clearly. 97 of these firms have reported results. Only 58% beat estimates and they had a 15.96% decline in EPS. That’s a better clue as to how bad Q2 will be.