Choppy Trading Action Continues
The stock market rallied modestly on Wednesday as the choppy trading action continued. The S&P 500 was up 0.65%, the Nasdaq was up 0.38%, and the Russell 2000 was up 1.15%. The VIX was down 0.96 to 19.35 which still shows the market is in a correction. The CNN fear and greed index was up 2 points to 18 as it remained in the extreme fear category. As I will get to later in this article, the bond market is certainly signaling fear. The stock market isn’t doing terribly as it has stayed above the August 14th low of this correction. There needs to be weaker economic reports to send stocks lower. Whenever stocks selloff on trade war fears, Trump talks positively about the odds of a deal sending stocks higher.
Investor Sentiment Is Pessimistic
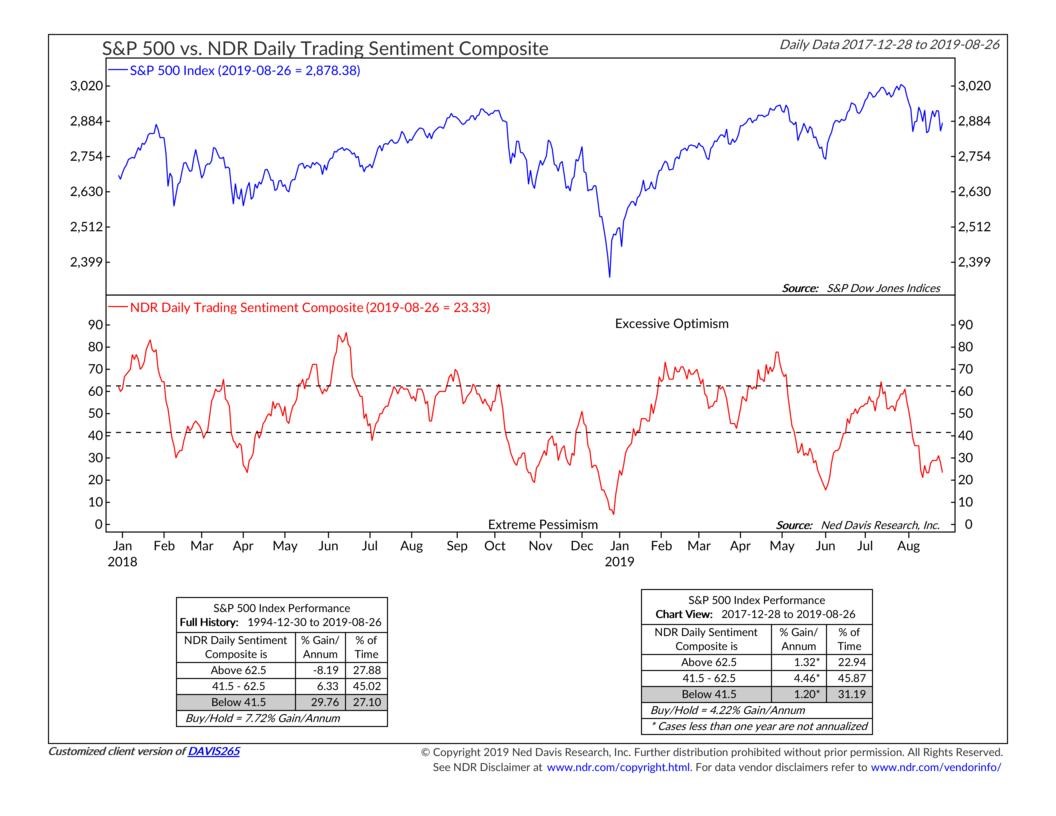
The AAII investor advisor sentiment index showed the percentage of bulls fell to 43.9% which is the lowest level since June. The percentage of bears increased to 18.7% which is the highest since April. The bull bear spread of +25.2% is just above the lowest level since the start of the year when the market was recovering from the terrible correction of late 2018. As you can see from the chart below, as of August 26th, the NDR trading sentiment index has fallen to 23.33. It’s not as low as it was in early June or late December, but it is below 41.5 which means sentiment is extremely pessimistic. Since the start of 1995, the S&P 500 has increased 29.76% per year when this index has been below 41.5.

Sector Performance
The only sector that fell on Wednesday was the utilities which were down 0.26%. The sector has still had a great year. It won’t stay down if yields continue to fall. As I mentioned in my previous article, oil was up because inventories fell more than expected. Therefore, the energy sector increased the most as it was up 1.4%. Consumer discretionary was the 2nd best performer as it increased 1.09%. Consumer staples have outperformed consumer discretionary in the past 12 months which some think is a strong recession signal.
On a year to date basis, retail stocks have actually outperformed the S&P 500 by 2% (18% gain vs. 16% gain). 19 of the 26 retail stocks in the S&P 500 are up year to date. Target stock is up 21% this month. Speaking of the bifurcation of year to date and 12 month performance, the big tech stocks have done well enough to drive the S&P 500’s performance in 2019. Obviously, the 12 month performance will converge with year to date performance as we get later in the year.
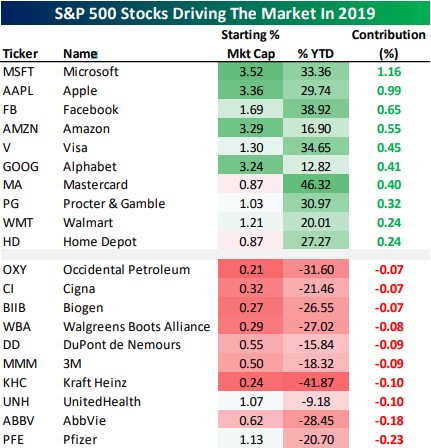
The table below shows the biggest drivers of the S&P 500 and the stocks dragging the index down the most. As you can see, Microsoft, Apple, Facebook, Amazon, and Alphabet are all top drivers. They have helped the S&P 500 gain a combined 3.76% this year. There are a bunch of healthcare stocks in the group that hurt the S&P 500 the most. They each had a small impact on the S&P 500 even though healthcare is the 2nd biggest sector in the index.
Treasuries Have Had A Great Run
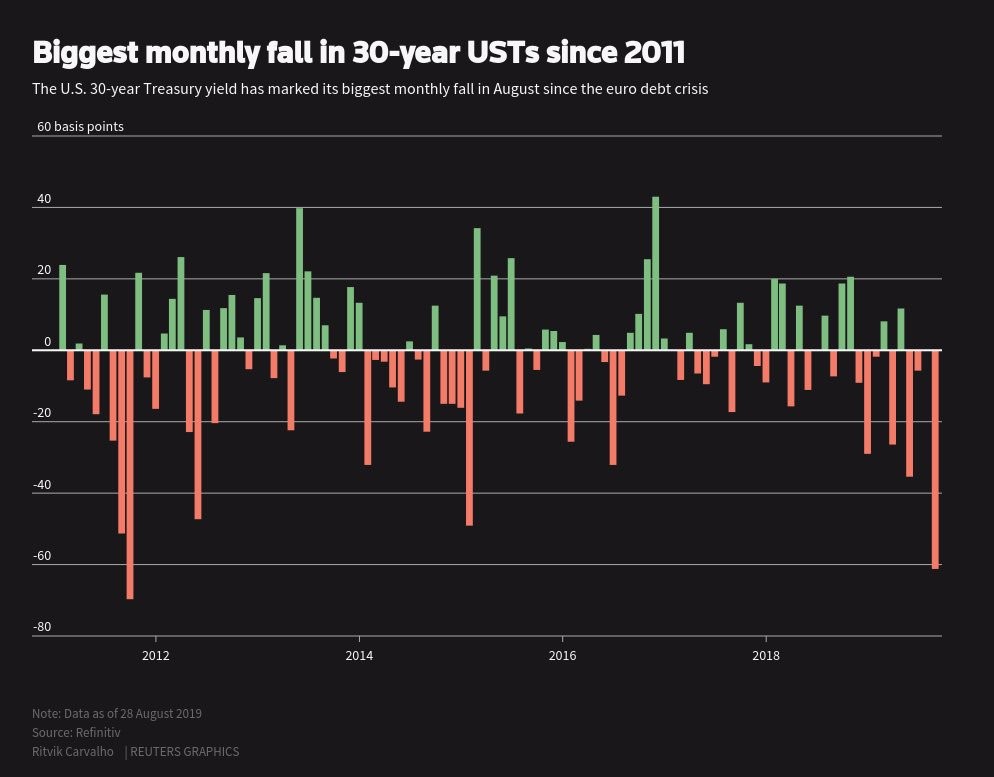
The rally in treasuries has gone much further than I expected it to. The 30 year yield is now at 1.93%. It’s recent low of 1.9% is a record low. As you can see from the chart below, August has seen the 30 year yield’s biggest monthly decline since late 2011 which was during the European debt crisis. The monthly return in the long term treasuries index is 10.2% which is its best performance since November 2008 when it increased 12.3%. Since 1978, there have only been 4 months with better performance than this month.
The 10 year yield is about to join the 30 year yield in the record low club. It is at 1.45%. The record low is 1.36% which was hit in July 2016 after the Brexit vote. Ironically, another Brexit vote is coming this fall. That just shows how long the Brexit process has taken without anything getting done yet. The 2 year yield is at 1.49%, meaning the inversion is 5 basis points. As I have mentioned, investors should want to see an inversion because curve steepening is historically correlated with recessions.
Fed Just Reacting To The Data
There hasn’t been much change in the Fed funds futures market recently as traders still expect one rate cut in September and one more in either October or December. I think the trade war is more front and center in investors’ minds as the first layer of the new tariffs approaches. The Fed can only do so much to save the economy from issues created by the trade war. Stocks shouldn’t react sharply to the September Fed meeting. There will be a cut along with rhetoric in which the Fed says it will react to the latest data.
There has recently been controversy about how the Fed can prevent the trade war. The reality is there is nothing it can do. If the Fed were to raise rates to make Trump reconsider tariffs, it would tank the economy and stocks. The Fed would be criticized for being political instead of independent. It would be a case of the Fed cutting off its nose to spite its face. In the analogy of the game of chicken where 2 cars are speeding at each other, the Fed is like a crossing guard. The speeding drivers, pay no regard to the crossing guard.
Conclusion
The stock market is extremely headline driven which makes it tough to forecast. The 3 factors which aren’t as tough to forecast are the housing market (bottoming), manufacturing (weakening/contracting), and the consumer (very strong). Even the consumer’s picture is a bit muddied by the tariffs. I will be watching the Redbook same store sales reports in September to see if there are any sudden reactions to the new tariffs. Negotiations might heat up as the tariffs start to hurt the economy. That could be a net positive for stocks.