As I expected, the labor report showed 261,000 jobs created. It was far below the 310,000 expected as the hurricane effect didn’t turn out to move as many jobs from September to October as economists thought. The jobs report is always tricky to project. Adding the weather into the mix only made it more challenging for prognosticators. Instead of the jobs moving from September to October, they stayed in September as there was a big revision like I thought would happen based on the ADP report showing 135,000 jobs added in September. The 33,000 jobs decline in September was pushed up to an 18,000 increase. The August result was also revised higher from 169,000 to 208,000 which means the September number might be revised even higher. While these reports may be backward looking, I’d rather focus on a number we know to be true compared to one which can be updated in a drastic manner. It wouldn’t be impossible for the October report to eventually come in at 310,000 jobs created after being revised twice.
With this 90,000 improvement and the 261,000 jobs added in October, the unemployment rate fell to 4.1% which is the lowest rate since December 2000. We’re nearing the point where whatever indicator you look at should show the labor market is very tight. This isn’t good news for stocks. It likely means we’re near the end of the business cycle. I think the tax cuts could stimulate the economy another year to stave off a recession. It’s weird timing to get a stimulus at the end of the business cycle instead of after a recession starts. The reason the timing is off is because usually recessions occur at the end and beginning of presidencies. Presidents like to stimulate the economy to get it off to a good start. The recession usually provides an impetus to get a tax cut/spending increase done. In this case, we’re just getting the tax cut with no recession. That could be a mistake because if a recession occurs right after the stimulus, then the government won’t have any ammo to stave off the recession.
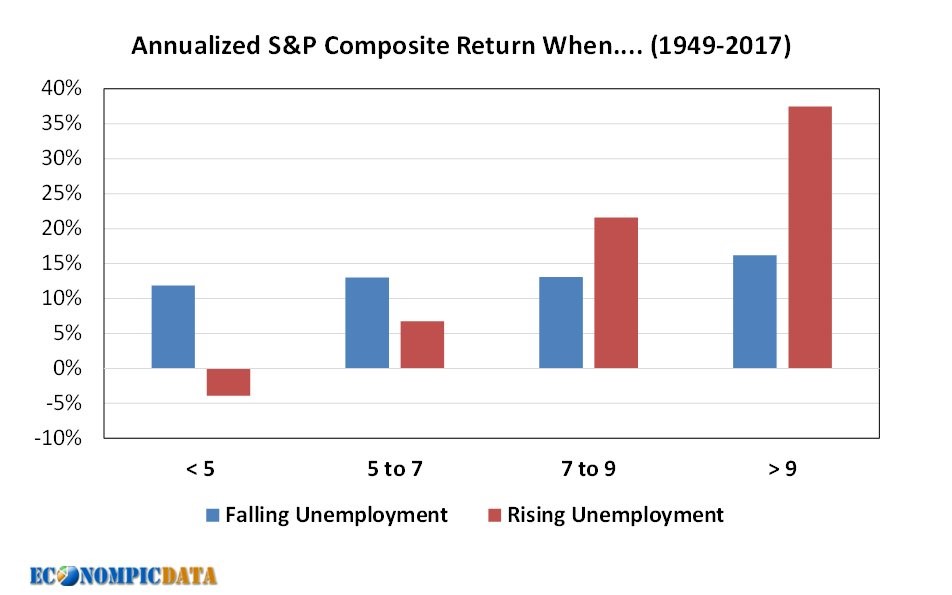
As I said, the low unemployment rate is bad for stocks. The chart below breaks down the returns when the unemployment rate is at various levels. As you can see, stocks rise about 11% per year in the situation we’re at now. The unemployment rate is below 5% and falling. Once unemployment starts rising, the stock performance is -4% per year which is the worst scenario. This chart looks exactly like the CAPE one. When valuations are high and the unemployment rate is low, it’s a recipe for trouble when the economy starts moving in the wrong direction. Luckily, we aren’t there yet.
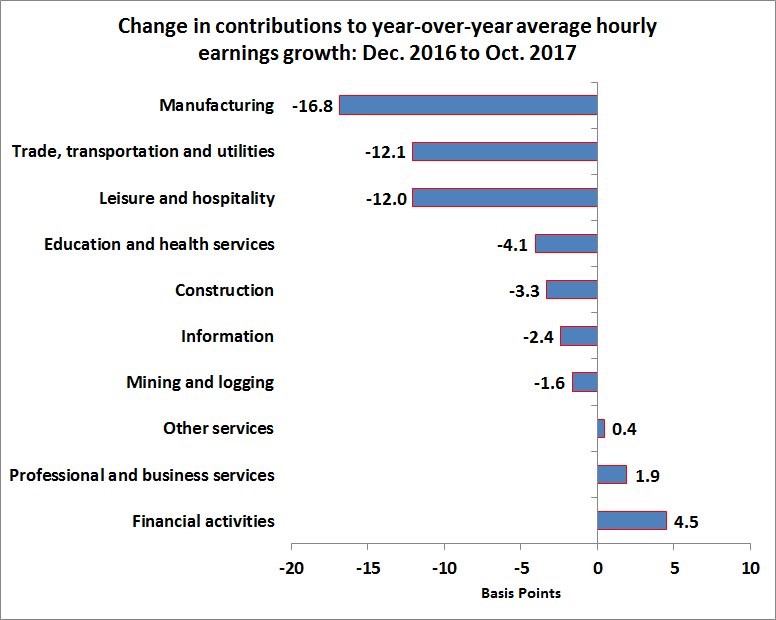
Getting back to the labor report, the details of the report weren’t as good as the headline number as wage growth was only 2.4% year over year which missed estimates for a 2.7% increase. September growth was revised down to 2.8%. Month over month there was no growth in October which was below the 0.2% growth expected and the lowest growth rate since June 2015. This lackluster wage growth leads us to the chart below. It shows the contributions to year over year hourly earnings growth by industry. This is much different from some of the other stats we’ve looked at as this shows the manufacturing industry being the worst performing one followed by the trade, transportation, and utilities industry. This is the exact opposite of the ECRI employment cost report.
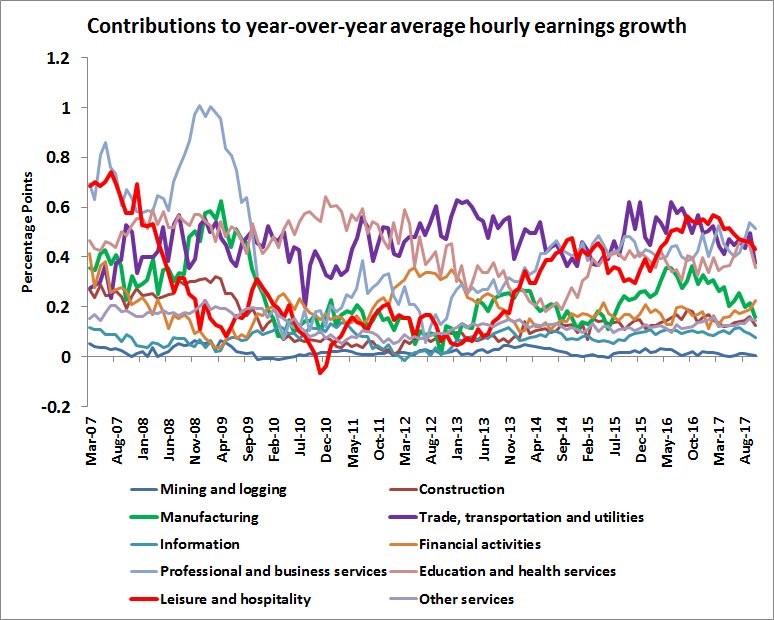
The chart below shows the historical details of chart above. As you can see, leisure and hospitality and manufacturing have had a few months of deceleration. This gives context to the amount the weather effected the latest report. The trade, transportation, and utilities segment appears to have taken the sharpest drop. That would be the one most effected by the hurricanes as there has been an increase in backlogs with the supply chain in shambles.
The chart below breaks down the jobs added by industry in October. As you can see, leisure and hospitality had a big bounce back going from losing over 100,000 jobs to adding 106,000 jobs. This is mostly hurricane related as most of the job losses in September were temporary. Manufacturing added 24,000 jobs which is in line with the regional Fed reports. The professional business segment had a solid month as it gained 31,700 jobs. There was a 18,300 increase in temporary help due to the storm impacts.

The labor force participation rate fell from 63.1% to 62.7% making the labor market look weaker than the unemployment rate indicates. The labor participation rate is back near its 4 decade low. The number of people leaving the labor market was 968,000. The labor force shrunk by 765,000. That’s why the unemployment rate fell even though the number of employed people fell by 484,000.
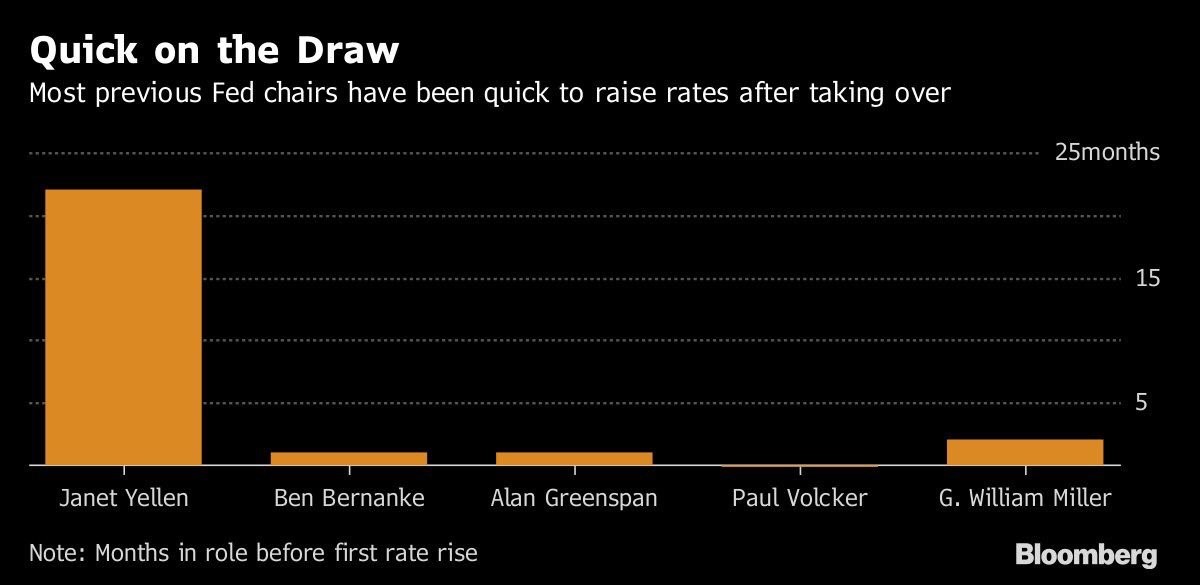
I mentioned the timing of the economic stimuli and recessions in relation to presidencies. President Trump picked a new Fed chair after the current Fed chair completed her first term. That’s the first time that has happened in the modern era. The chart below shows what has happened the past few times a new Fed chair has taken the helm. Most have raised rates quickly. I expect the same from Powell as the Fed will raise rates twice next year. His first hike should could in the first 6 months of his tenure. He has been left with low rates, low unemployment, and low inflation. That’s an unusual combination.
Conclusion
It’s difficult to have many takeaways from the labor report on Friday because the results were disjointed because of the hurricanes. The biggest change was the revision which added 90,000 jobs. The data on wage growth should give the Fed pause about raising rates at an accelerated clip despite the fact that GDP grew above 3% two quarters in a row. The CME Group website has the chances of a hike in December at 96.7%, showing the odds didn’t budge as a result of this report.