The Estimates Are Done Rising
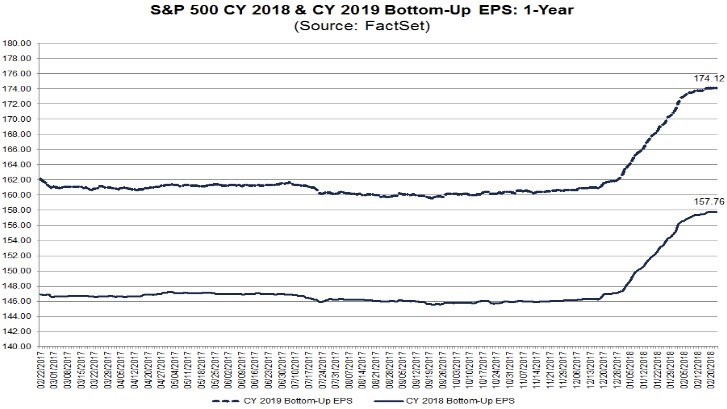
The Q4 2017 earning season is now almost over. I will be reviewing the S&P Dow Jones numbers, but first let’s look at the chart which shows future expectations. With the GAAP earnings being hurt by tax related write downs in Q4, the future estimates are the most important aspect to review. As firms reported earnings, analysts updated their models with the lower tax rate. As you can see, there were sharp bumps in the estimates for 2018 and 2019. As the analysts were raising estimates, we wondered when the boost would be finished. I determined it would likely end when the earnings season is over. We’re seeing that situation play out. As you can see, the slopes of the curves have flat lined. I expect the current estimates to be near the peak of expectations since earnings season is 90% done. Now we’ll see declines as we get closer to the results like usually happens. Double digit earnings growth in 2019 is unlikely. Earnings growth around 15% plus or minus 1% is probable.
It’s very tough to determine what is priced in. I tweeted Jeffrey Gundlach about the 18% expected earnings growth in 2018 and he said it was priced in. The reason it’s tough to know what is priced in is because stocks rallied from the election until the tax cuts were passed based on the improving business environment. The stock market hasn’t rallied that much since the tax cuts were passed. You need to determine how much of the post-election rally was due to the improving economy in 2017 and how much was caused by the hope for tax cuts and regulation reform.
If the market is expecting $157.76 in S&P 500 earnings, stocks will fall this year because that number won’t be hit. However, the market’s expectations aren’t the same as what the analysts expect. If the two were the same, stocks that beat estimates would always rally and stocks that miss estimates would always fall. The market knew these estimates would increase right after the tax cut was passed. Stocks have rallied many times this cycle as the earnings estimates have fallen. As long as the growth after the decline in estimates is in line with the price increase, the multiple stays the same. To be clear, earnings matter, but the market is one step ahead of the analysts.
Earnings Season Was Great
As I mentioned, earnings season is almost over. As of February 23rd, 452 of 505 firms have reported results. 75% have beat sales estimates. The best sector was technology which saw 85.71% beat estimates. The sector which has the most firms left to report is consumer staples. Only 72.62% have reported. One of the most actively traded stocks in this sector in the past few days is General Mills. The firm has been hurt by the decline in the cold cereal segment and the inability of Yoplait to compete with Chobani and the other Greek yogurt brands. In an effort to revitalize growth, the firm bought natural pet foods company Blue Buffalo for $8 billion. This price which was a 41 multiple on forward earnings. General Mills stock fell after the acquisition. The stock is down 9.62% since February 15th.
The blended operating earnings for Q4 is $34.13. The bottom up P/E on 2018 operating earnings is 17.59. The current indicated dividend yield of the S&P 500 is 1.88%. The operating margin for Q4 2017 is messed up because of the write downs caused by the tax cut. For example, year over year margins were down 30.92% in the tech sector and they were up 167.39% in the telecom sector.
Stocks Soar On Monday
It’s now fairly obvious that the decline in February was a correction and not the beginning of a bear market. Unbiased observers stated the economy needed to fall off a cliff for the decline in stocks to turn into a bear market. While some data points have weakened in 2018, there’s almost nothing that justifies the thesis that a recession will occur in 2018. Many investors believe that stocks don’t forecast the economy. Instead they believe stocks act in tune with the economy. No matter what you believe, stocks should recover from this correction. With the rally on Monday, they almost have.
The S&P 500 was up 1.18% and the VIX was down 4.18% to 15.80. The S&P 500 is now only down 3.25% from its all-time high. Apple has been one of the leaders of the market as the stock is up 15.35% from its February low. After a great quarter, Amazon has soared to an all-time high. The stock is up 4.9% from its January peak. The dollar index was down 0.13% to $89.85. The best case scenario would be for a stable dollar.
10 Year Yield Falls
The 10 year bond yield fell sharply to 2.83% in the morning, but then it increased to 2.8623% in the afternoon. It was down 37 tenths of a basis point on the day. I still expect yields to fall, but obviously I have less confidence in that call now that yields have fallen 9 basis points from the peak. The correlation between the S&P 500 and the 10 year bond yield varied on Monday. In the beginning of the trading day it was negative; it was positive in the afternoon. The latest difference between the 10 year bond yield and the 2 year bond yield is 64 basis points. This continues the trend of the past few days where the curve has flattened. The 50 basis point differential is an important mark. If the curve flattens past that point, it will be the biggest story in the financial media. You shouldn’t panic if that happens, but be aware that scary headlines are coming as the predictions for an inversion pick up.
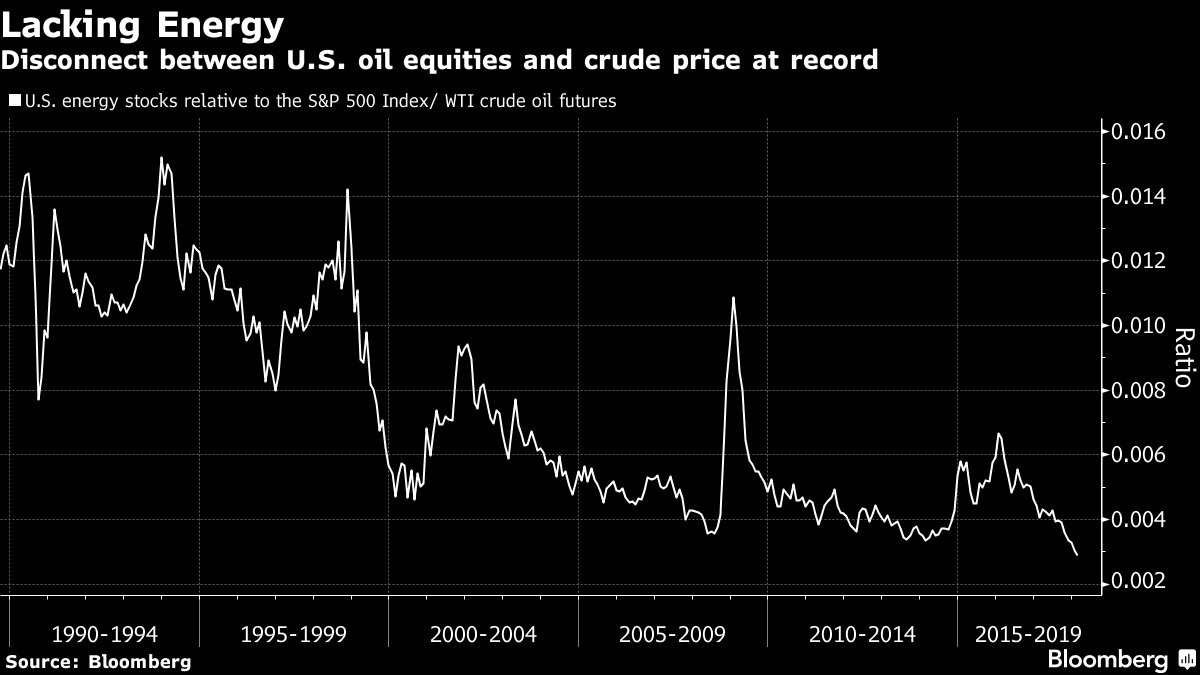
Oil Rallies
Unsurprisingly, oil was up 36 cents to $63.91. This is the best close in 3 weeks. The correlation between oil and the S&P 500 since June is 96%. Ironically, even though the market is highly correlated to oil, energy stocks aren’t. As you can see from the chart below, the energy sector’s correlation to oil is at a record low. It appears to be in a long term trend lower with a particular decline in the past few years. The correlation peaks when oil crashes. That’s the worst of both worlds. Energy stocks fall when oil falls and they don’t rally with oil.