Redbook Same Store Sales Growth Inches Up
In the week of October 26th, the Redbook same store sales growth rate improved from 4.3% to 4.5%. That’s the 2nd straight week where it increased 2 tenths. It’s still not a great reading though as growth was in the 5% to 6% range in August and September. It implies retail sales growth will fall slightly in October. This comes after the University of Michigan sentiment index fell from its initial reading, but rose from September.
Some good news from Redbook is that this isn’t the important holiday shopping season as we are about 1 month away from Black Friday. It’s a good sign for the consumer that Amazon’s retail sales division did well. Its main disappointment came from AWS which is seeing slowing growth and just missed out on a $10 billion government contract to Microsoft’s Azure. It’s also notable that Redbook’s comps are about to get really tough. But the retail sales comp is really easy in December. It wouldn’t be surprising if we soon seen negative sales growth in the Redbook report. Delta of its negativity will determine my reaction to it.
Conference Board Index Falls Slightly
University of Michigan consumer confidence reading showed a minor sequential increase. A weak point was that expectations fell yearly. Overall, it was a solid report. It wasn’t as great as the Bloomberg Consumer Comfort index which has been stronger than the other 2 confidence readings in the past few months.
Its reading of 63.5 in the week of October 13th was only 1.2 points off its July high which was its best reading in 18 years. On Tuesday, the October Conference Board index was updated. It improved from the original September report, but fell from the revised September reading. September index was revised from 125.1 to 126.3.
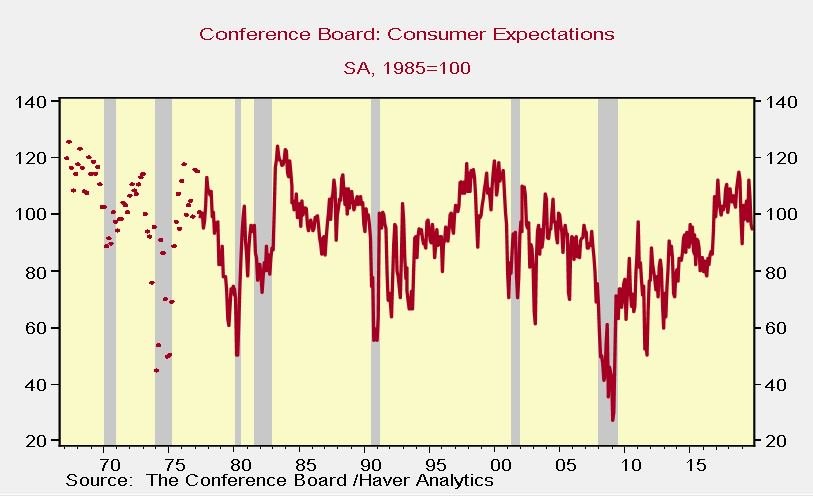
October reading was 125.9 which missed the consensus which was 128.8. Current index increased from 170.6 to 172.3. As you can see from the chart below, the expectations index fell from 96.8 to 94.9. This isn’t a bad reading, but its decline from its peak implies there might be a cyclical turn coming. I’m not saying a recession is coming, but if expectations fall a bit further, there will be a recession signal. The economy needs a cyclical turnaround early next year.
Now let’s look at the details of this report. Assessment of business conditions improved as those saying conditions are good improved 1.8% to 39.2%. And those saying conditions are bad fell 1% to 11.2%. Net percentage saying conditions are good improved 2.8%. That’s not a huge difference, but it’s a positive. Especially since the bears are promoting the chart on CEO confidence which shows management teams are the most bearish since the last recession. That chart should be considered wrong at face value. The economy isn’t in a recession.
And the next recession probably won’t be nearly as bad as the prior one. I say that because the banks are in better shape and consumers have much less leverage. It’s almost impossible to get to that level of leverage again without housing debt. Mortgage debt for most people is by far their largest category of debt. Even student loans and auto debt combined can’t get there.
Oddly the percentage of consumers saying jobs are plentiful increased and the percentage saying jobs are hard to get increased. Those saying jobs are plentiful increased 2.4% to 46.9% and those saying jobs are hard to get increased 0.8% to 11.8%. That’s a net improvement of 1.6%. There were similar mixed feelings on expectations for business conditions in the next 6 months. Those expecting conditions to improve fell 1.4% to 18.6% and those expecting conditions to get worse fell 1.7% to 11.6%. That’s a net positive change of 0.3%.
The weakest part of this report is arguably the most important. Consumers know the most about the labor market. Those expecting more jobs in the next 6 months fell 1.3% to 16.9% and those expecting fewer jobs rose 2.4% to 17.8%. That means there are now more consumers expecting the labor market to get worse than expecting it to get better.
Let’s see how that translates to the monthly BLS report. It’s consistent with Markit’s expectation for about 50,000 jobs created in October. There might even be negative job creation. Finally, on the positive side, those expecting income growth to improve rose 1.4% to 21.1%. Those expecting a decline stayed at 6.5%.
National Home Price Growth Finally Improves
August Case Shiller 20 city national home price index missed estimates. But the national home price index’s growth rate improved for the first time since March 2018. There was weakness in the major cities, but improvement nationally. 20 city index was down 0.2% monthly on a seasonally adjusted basis. That missed estimates for -0.1% and July’s growth of 0%.
That was only the 2nd monthly decline since March 2012. On a non-seasonally adjusted basis, yearly 20 city price growth was 2% which missed estimates for 2.5%. That’s the same as July’s reading; this is a joint 7 year low.

As you can see from the chart above, national NSA yearly home price growth was 3.2%. Even though it increased on a rounded basis, yearly growth only went from 3.14% to 3.165%. That’s a 2.5 basis point increase. The housing market isn’t exactly setting the world on fire.
Furthermore, the 2 year growth stack actually fell because last year’s growth rate fell from 5.95% to 5.68%. The 10 city index is seeing even worse growth than the 20 city index as its growth was 1.5%. Bigger the city, the weaker the housing price growth.
Phoenix showed the greatest strength out of the top 20 cities as its price growth improved from 5.75% to 6.29%. Seattle’s growth went positive as it improved from -0.65% to 0.66%. Las Vegas’ big descent continued as its growth rate fell from 4.68% to 3.31%. That’s the weakest growth since August 2012.