Earnings Growth Top Not A Worry
Earnings growth is expected to peak in Q3 2018 which has already become a big story as investors have looked for bearish arguments since stocks have been flat or down for much of this year. This is a case of reaching for an argument which sounds good, but is completely wrong. The results have been good in Q1 and Q2 is shaping up to be great. There has been multiple compression which I expected this year as multiples elevated last year in anticipation of the tax cuts. However, stocks won’t decline because of slowing earnings growth.
In fact, the only time in the last 25 years that the peak in earnings growth occurred alongside the peak in stocks was Q1 2000. That also occurred when stocks were much more expensive than now; I don’t think we’ll see a repeat of that. Also, many of the stocks which rose parabolically during the tech bubble had no earnings. This bull market has been led by stocks with superior earnings growth. The latest update of Q2 earnings season is good as 9 S&P 500 companies have reported results and all 9 firms have beat their estimates.
The average Q2 earnings growth is now 29.1%. The blended average earnings growth which includes estimates and those 9 reports is 18.5%. That figure is likely too low. Estimates for Q3 and Q4 increased which is great for stocks and boosts the case for them to exceed the January highs. Earnings are pushing up stocks while the trade war rhetoric pushes them lower. Next week 11 companies report earnings. We aren’t in the meat of earnings season, but these results still are very important.
Predicting The Next Correction
I’m not expecting another correction since earnings look very strong. The biggest negative for stocks right now is the potential for a trade war. Even with a weakening global economy and a flattening yield curve which is hurting the banks, stocks have been mostly resilient in the past 2 months. The recent weakness this week could be enough to consolidate the S&P 500 allowing it to power towards new record highs.
I find the chart below very interesting. It’s great because it is simple. It shows the possibility of a 10% correction if the leading economic indicators are at their all-time high or if they aren’t. This analysis goes along with the narrative that predicting a recession when economic growth is very strong is a mistake. It’s possible that growth will suddenly collapse, but there needs to be a major catalyst for that. Since that situation is unlikely, most economists don’t expect a recession in the next 12 months.
In this case, the chart is saying if growth is firing on all cylinders, a correction is unlikely. An exogenous effect like a government shutdown, a war, or a trade war is the only thing that can cause a correction when the leading indicators are hitting records.
The one issue I have with this analysis is stocks are one of the leading indicators. A market reaching record highs means it has momentum. I’d rather bet on economic growth momentum than equity momentum because it can’t change because of quick sentiment shifts. That point doesn’t completely discount this chart because stocks are only one of ten components of the leading indicators.
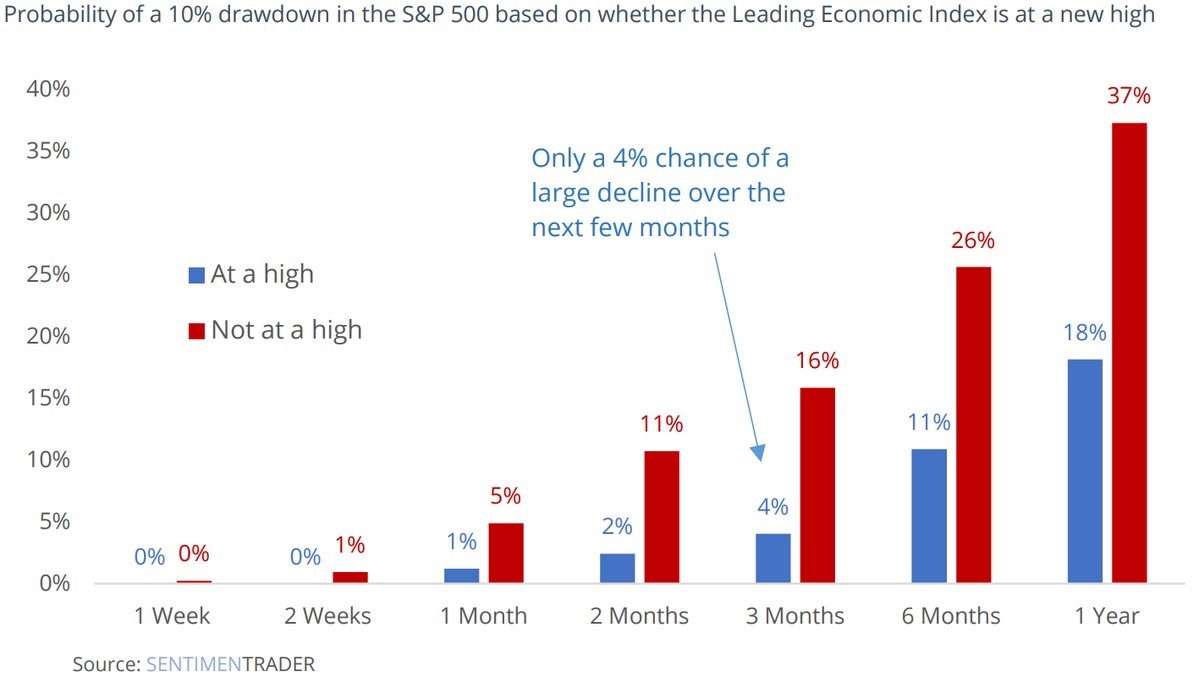
Clearly, bullish investors want the leading indicators to be at a record. Currently, the leading indicators are at 150.08 which is below the February 2nd peak of 152.42. Therefore, there is a 26% chance of a 10% correction in the next 6 months instead of an 11% chance. As long as the month over month growth stays positive, this index will reach record highs soon. The month over month growth for May was 0.2% which missed the consensus for 0.3% growth. Even though I think the jobs market will remain strong for the rest of the year, it will be very difficult for the jobless claims, which is one of the metrics in the leading indicators report, to improve.
Jobless Claims Fall Near Record Low
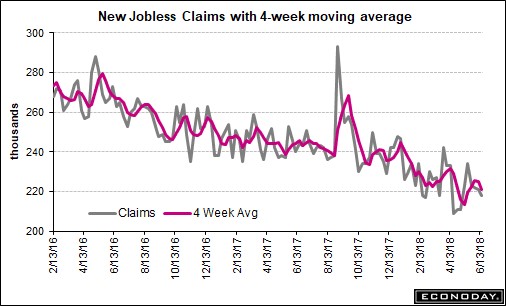
The latest claims report was 218,000 which was a 3,000 drop. As you can see from the chart below, the 4 week moving average fell from 225,000 to 221,000. The current situation is the equivalent of scraping the bottom of an ice cream bowl when it’s empty. The claims to labor force ratio is already at a record low, so it’s questionable if claims can get below 200,000. I expect it to stay below 250,000 for the next 12 months until a potential recession shows signs of occurring.
Tariffs Weakening Manufacturing?
The June Markit PMI flash reading showed the services sector strengthened and the manufacturing sector weakened. With the weakness from this report and the two regional Fed reports, its safe to say the manufacturing sector is slowing slightly. The ultimate question is whether this is because of the tariffs or if it’s just slowness because the high rate of growth in May was tough to match.
The composite index was 56 which was 3 tenths above last month’s reading and 3 tenths below the consensus. The economy really benefited from the fact that the services sector is much larger than manufacturing. The manufacturing PMI was 54.6 which was down 2 points from last month and was 1.9 points below the consensus. The services PMI was 56.5 which was 3 tenths above the consensus and 8 tenths above last month’s report.
This flash reading is consistent with 190,000 jobs created which is a run rate consistent with a falling unemployment rate. The comments from the report say GDP growth will be well over 3% despite this weakness in manufacturing because of strength in services and the strength seen in the first 2 months of the quarter. One issue I’ll be watching for the rest of the year is rising inflation combined with slowing growth. Even though there was some weakness in this report, manufacturing input prices charged by private sector firms increased to the greatest extent since September 2014.