
If you’re following the market at all, you’ve likely heard the term “short.” The word short is used for selling shares you don’t own or even an selling an option or futures contract. Typical short sellers of stock are hedge funds or more sophisticated traders. However, what does that mean for the average trader? How can a trader use this information to inform them about their trades?
The intent of today’s post is to address how a trader can use the short interest statistics as a stock selection criterion. By incorporating short interest into you evaluation process, you’re setting yourself up for potentially explosive moves.
What does it mean to be short?
Before you can fully grasp the application, it’s imperative that you know what it means to be short. Short selling is a strategy that speculates on the downside movement in the stock. That means that you’re selling a stock you don’t own with the intent of buying back at a lower price. For example, if you short at $35 and the price falls to $32, you just made $3 per share minus any interest costs incurred from borrowing. This may sound like putting the cart ahead of the horse, but it’s a very prominent strategy among more sophisticated investors.
What is a short squeeze?
When a stock has already been heavily shorted, it sets up for a potential short squeeze. A short squeeze is when the price begins to move higher and causes the shorts to “cover.” If a short is covering, that means that they are buying the stock. If a lot of the shorts are covering at the same time, it can create a powerful, bullish move in the price. This is referred to as a short squeeze. There were many great short squeeze examples last year, but GameStop Corp (NYSE: GME).
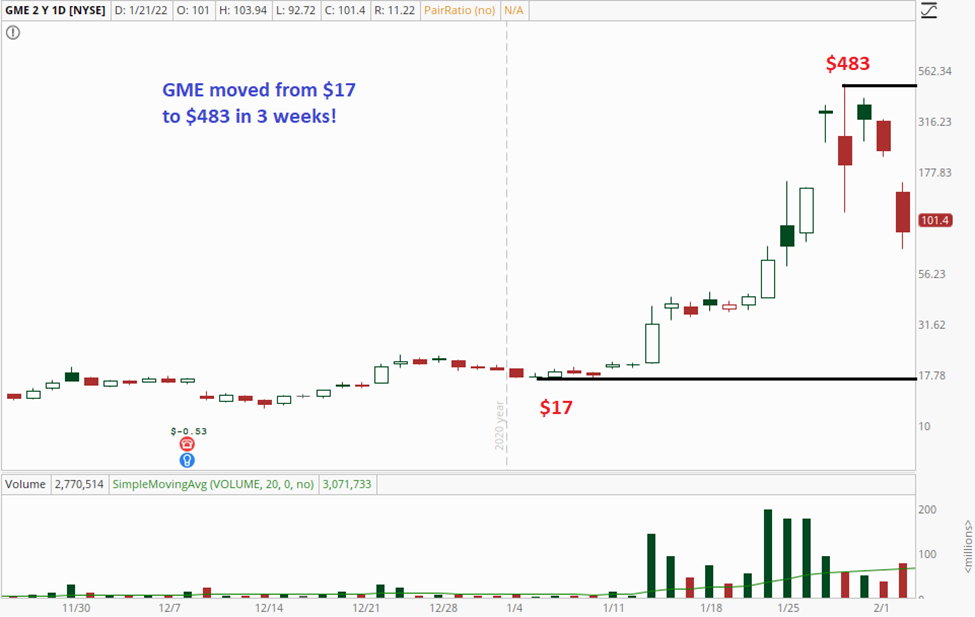
Now, GME was an extraordinary example of a short squeeze. Its short interest metrics were very compelling for close to a year before it took off like that. There currently aren’t any stocks with that degree of short interest, but it gives you an idea of how powerful a short squeeze can be.
Short Interest Analytics
Rather than analyzing a stock for a potential short-selling opportunity, you can evaluate short interest. GME is one example of a stock so heavily shorted that it becomes bullish.
The process of evaluation is a matter of looking at the number of shares short, the float of a stock and average volume. The use of these measures allows you to calculate two key metrics: Short % of Float and the Short Ratio.
Short % of Float
Just looking at the total number of shares short doesn’t give a complete picture. That’s because each stock varies in the number of shares outstanding or more importantly float. The float represents the shares available to the public to buy or sell.
The short % of float takes the number of shorted shares and divides it by the float. A value greater than 5% is generally considered high for stocks with large floats. Stocks with small floats, over 20% would be significant.
Short Ratio
By looking at the percentage of shares shorted of the float is important but is incomplete. The reason it’s incomplete is it doesn’t necessarily reflect how easy it is for those shares to be covered. Stocks that have a high amount of daily volume will absorb short covering more easily than a low volume stock.
The short ratio takes the number of shares short divided by the average volume. Therefore, the short ratio tells you how many days of volume it will take to cover. For example, if the short ratio is three, it will take three days to cover the number of shares short based on the daily average volume. A short ratio of five or higher would be considered high. That means the race to cover will likely have a material impact on the price of the stock.
Example: Beyond Meat, Inc (NASDAQ: BYND)
Let’s take a look at BYND. Now, this type of analysis doesn’t give you a complete picture of the stock, but it could be used alongside other types of analysis. For example, maybe the company is experiencing strong positive analyst revisions for earnings and revenues. High short interest could make the ensuing move explosive!
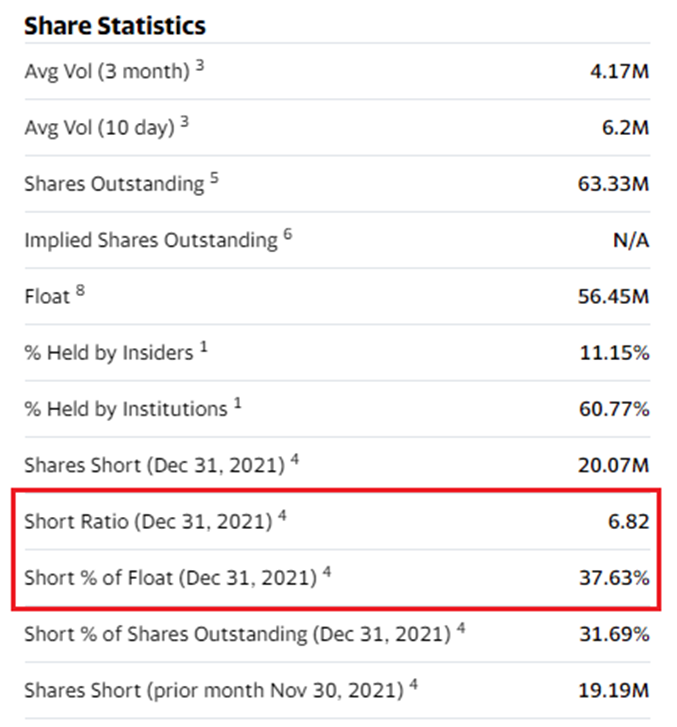
Using the Yahoo! data below, the first thing to notice about BYND is that the Short % of Float is very high at 37.63%. That likely means that the company’s float is small and is confirmed when you see the float is 56.45M shares.
The next question to answer is how easily it will be to cover the 20.07M shares that are currently short. That is easily answered by looking at the Short Ratio of 6.82. That means that it will take nearly seven days to cover the short interest. That is a high value and shows that a short squeeze could materially impact the share price in a positive way.
Conclusion
Using short interest data could reasonably be a part of your stock selection criteria. It can act as a life vest for your stock as shorts cover incrementally or as a major source of return in a short squeeze. The fact you have committed buyers in the advent of a sell-off or if the price begins to rally quickly certainly can’t hurt. Hopefully this guide will help you apply short interest analytics to your trading.
See how unlocking the Vomma Zone can help you better understand when volatility is about to rise.
Want learn more about how to work with me? Check out Trader by Your Side!
Not a subscriber? Become a TheoTrade member